- Data SaaS Platform usage documentation(3.0)
- 一、Platform address
- 二、Dashboard
- 1. The meaning of Dashboard
- 2.A page overview of the Dashboard
- 3. Data Dashboard usage guide
- 3.1 Create/Edit Dashboard
- 3.1.1 Create
- 3.1.2 Rename
- 3.1.3 Delete
- 3.1.4 Dashboard movement
- 3.2 Manage Dashboard content
- 3.2.1 Add chart
- 3.3 Dashboard sharing
- 3.3.1 Set Dashboard sharing
- 3.4 Duplicate Dashboard
- 3.5 Global filtering
- 3.5.1 Modified analysis time
- 3.5.2 Scenario in which the time frame is modified
- 3.6 Bulk download
- 4. Guidelines for the use of project space
- 4.1 Project space usage scenarios
- 4.2 Create/Edit space
- 4.2.1 Create space
- 4.2.2 Edit space
- 4.2.3 Delete space
- 4.3 New space signage
- 4.3.1 Create a new Dashboard directly into the space
- 4.3.2 Move self-built Dashboard to space
- 5. Dashboard management
- 5.1 Batch move or delete your own Dashboard
- 6. Dashboard chart
- 6.1 Dashboard chart composition
- 6.2 Operation rights of different roles on the Dashboard chart
- 三、Analysis
- 1.Events
- 1.1 The significance of Events
- 1.2 Location of Events
- 1.3 Use of Events
- 1.3.1 The selection of analysis indicators
- 1.3.1.1 Additive formula
- 1.3.1.2 Add multiple metrics
- 1.3.2 Selection of grouping items
- 1.3.2.1 Set the conditions for the specified group
- 1.3.2.2 Set multiple grouping
- 1.3.2.3 Set packet mode
- 1.3.2.4 Setting Event Breakdown
- 1.3.3 Selection of filtering criteria
- 1.3.4 Report setup, display, download and save
- 1.3.4.1 Shows the filter area Settings
- 1.3.4.2 Presentation of report contents
- 1.3.4.3 Query and download event details
- 1.3.4.4 Retention of reports
- 2. Retention
- 2.1 The significance of Retention
- 2.2 Location of Retention
- 2.3 Page overview of Retention
- 2.4 Usage Scenarios for Retention
- 2.4.1 Setting of analytical indicators
- 2.4.1.1 Initial event selection
- 2.4.1.2 Selection of screening conditions
- 2.4.1.3 Selection of return events
- 2.4.1.4 Selection of Calculate another metric
- 2.4.1.5 Group by
- 2.4.2 Setting of Display Setup Area
- 2.4.2.1 Period of analysis, duration of analysis and indicators
- 2.4.3 Chart presentation and data download
- 2.4.3.1 No increase in simultaneous display of display content
- 2.4.3.2 Increase the number of displays that can be shown simultaneously
- 2.4.3.3 Only display content that is displayed at the same time
- 2.4.3.4 Text alert
- 2.4.3.5 Data Download
- 3. Funnel
- 3.1 The significance of Funnel
- 3.2 Location of Funnel
- 3.3 Overview of the Funnel Analysis page
- 3.4 Scenarios for the use of Funnel
- 3.4.1 Setting of the indicator setting area
- 3.4.1.1 Setting of the indicator setting area
- 3.4.1.2 Adding, deleting and filtering conditions in the analysis step
- 3.4.1.3 Definition of the analysis window period
- 3.4.2 Setting of Screening display area
- 3.4.2.1 Default Initial Page
- 3.4.2.2 Definition of the analysis period
- 3.4.2.3 Operation of step checkboxes
- 3.4.2.4 Grouping Setup
- 3.4.3 Setting of Chart display area
- 3.4.3.1 Cumulative conversion funnel content
- 3.4.3.2 Elements of a conversion trend chart
- 3.4.4 Setting of Table display area
- 3.4.4.1 Tabular content of conversion charts
- 3.4.4.2 Tabular content of trend charts
- 4. Distribution
- 4.1 The significance of Distribution
- 4.2 Location of Distribution
- 4.3 Overview of the Distribution Analysis page
- 4.3.1 Indicator setting area
- 4.3.1.1 Setting up of user participation events
- 4.3.1.2 Setting of distribution intervals
- 4.3.1.3 Setting of filter conditions
- 4.3.1.4 Selection of Calculate another metric
- 4.3.1.5 Group by
- 4.3.2 Screening display area
- 4.3.2.1 Initial Analysis Page and Options
- 4.3.2.2 Default settings and selection range for each option
- 4.3.3 Chart display area
- 4.3.3.1 Tables
- 5. Flows
- 5.1 The significance of Flows
- 5.2 Location of Flows
- 5.3 Overview of the Flows Analysis page
- 5.4 Usage Scenarios for Flows
- 5.4.1 Definition of terms
- 5.4.2 Analysing the conditions of the angle-setting zone
- 5.4.2.1 Events analysed with participation
- 5.4.2.2 Setting Group Split Criteria for Events
- 5.4.2.3 Selection of events for analysis
- 5.4.2.4 Session interval settings
- 5.4.3 Setting of Screening display area
- 5.4.4 Setting of Chart display area
- 5.4.4.1 Lost or starting displays
- 5.4.4.2 Components of “more”
- 5.4.4.3 Horizontal scrollbar with left and right drag
- 5.4.4.4 Node Path
- 6. Interval
- 6.1 The significance of Interval
- 6.2 Location of Interval
- 6.3 Overview of the Interval Analysis page
- 6.4 View interval statistics
- 7. LTV
- 7.1 Significance of LTV analysis
- 四、Users
- 1. Attribute Analysis
- 1.1 The significance of attribute analysis
- 1.2 Location of attribute analysis
- 1.3 Page overview of Attribute Analysis
- 1.4 Scenarios for the use of attribute analysis
- 1.4.1 Conditions for analysing attributes
- 1.4.2 Group by
- 2. Cohorts
- 2.1 The significance of Cohorts
- 2.2 Location of Cohorts
- 2.3 Page overview of user segments
- 2.4 User Segmentation Usage Scenarios
- 2.4.1 List of subgroup base information
- 2.4.2 Conditional Cohort
- 2.4.2.1 New conditional Cohort
- 2.4.2.2 Viewing, editing and deleting conditional Cohort
- 2.4.3 ID Cohort
- 2.4.3.1 New ID Cohort
- 2.4.3.2 Viewing, editing and deleting ID Cohort
- 2.4.4 Result Cohort
- 2.4.4.1 New Result Cohort
- 2.4.4.2 Editing and deletion of Result Cohort
- 2.4.5 SQL Cohort
- 2.4.5.1 New SQL Cohort
- 2.4.5.2 Viewing, Editing and Deleting SQL Cohort
- 2.4.6 User Cohort List
- 3. Tags
- 3.1 The significance of Tags
- 3.2 Location of Tags
- 3.3 Overview of pages with Tags
- 3.4 Scenarios for the use of user tags
- 3.4.1 User tags and tagged values
- 3.4.2 Creation of user tags
- 3.4.2.1 Tag Definition
- 3.4.2.2 Updates and Backups
- 3.4.3 User Tag List Page
- 3.4.4 User tag detail page
- 3.4.4.1 Tag base information
- 4. User Search
- 4.1 The significance of user searches
- 4.2 Location of user searches
- 4.3 Overview of pages searched by users
- 4.4 Usage scenarios for user search
- 4.4.1 Search scope and query matching method
- 4.4.2 View a sequence of user behaviours for a single user
- 5. User Behaviour Sequence
- 5.1 The significance of user behaviour sequences
- 5.2 Location of user behaviour sequences
- 5.3 Page overview of user behaviour sequences
- 5.4 Scenarios for the use of user behaviour sequences
- 5.4.1 Components of a user behaviour sequence page
- 5.4.1.1 Default Initial Page
- 5.4.2 Contents and operations of the User Properties area
- 5.4.2.1 Filtering User Attributes
- 5.4.3 Content and operation of the behavioural statistics area
- 5.4.3.1 Initial page (bar daily trend)
- 5.4.3.2 Screening behavioural events
- 5.4.3.3 Settings and Effects of Time Selection
- 5.4.3.4 Calculated content of trend graphs
- 5.4.4 Content and operation of behavioural sequence details
- 5.4.4.1 Initial Page and Event Expansion Page
- 5.4.4.2 Expand Event Details to see event properties
- 五、Data
- 1. The significance of Data
- 2. Location of Data
- 3. Overview of the Data page
- 4. Data Usage Scenarios
- 4.1 Query Events
- 4.2 Query the event properties under a specific event
- 4.3 Querying and Editing Event Properties
- 4.4 Querying and Editing User Attributes
- 5. Dimension Table Properties
- 5.1 Meaning of Dimension Table Attributes
- 5.2 Scenarios for using dimension tables
- 5.3 Concept of Dimension Table Attributes
- 5.3.1 Basic Overview of Attribute Types
- 5.3.2 Creating Dimension Table Properties
- 5.3.2.1 Create an Entrance
- 5.3.2.2 Upload dimension table
- 5.3.3 Use of Dimension Table Attributes
- 5.3.3.1 Managing Dimension Table Properties
- 5.3.3.2 Download & Delete
Data SaaS Platform usage documentation(3.0)
一、Platform address
Address:https://demo.datahanding.com/
二、Dashboard
1. The meaning of Dashboard
Dashboard is a collection of charts, charts include reports, the platform can support a report into multiple data Dashboard, can also support multiple reports into a data Dashboard.
2.A page overview of the Dashboard
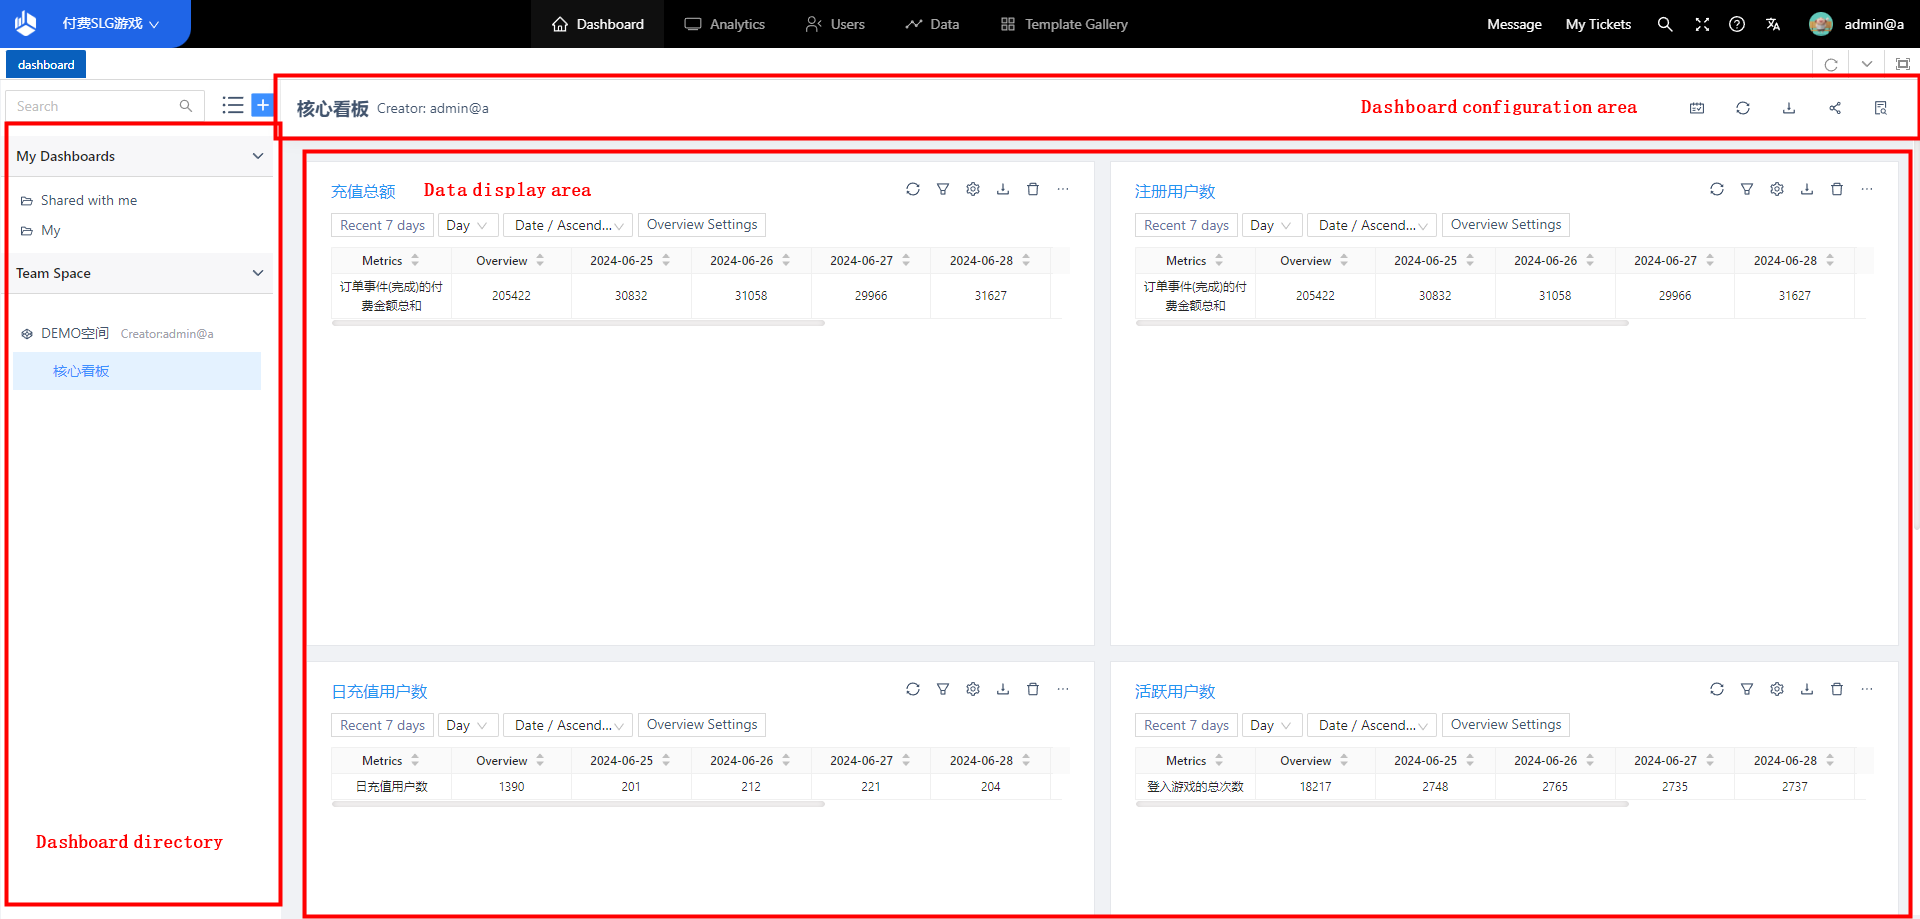
The data Dashboard consists of three parts: the Dashboard directory, Dashboard configuration area, and data display area
- Dashboard directory: Create Dashboard, view self-built kanban or team members’ shared Dashboard
- Dashboard configuration area: includes adding Dashboard content, setting Dashboard sharing, adjusting Dashboard Settings, refreshing Dashboard, and setting global time filtering for Dashboard reports
- Data display area: Displays the information of each Dashboard chart, customize the size and chart display type
3. Data Dashboard usage guide
3.1 Create/Edit Dashboard
3.1.1 Create
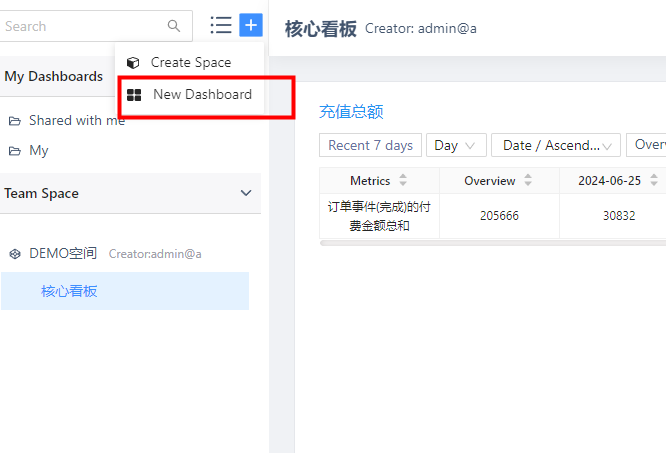
Company executives, administrators, analysts, or other members who have the permission to create Dashboard can click [+] in the left column of Dashboard and select “New Dashboard”.
3.1.2 Rename
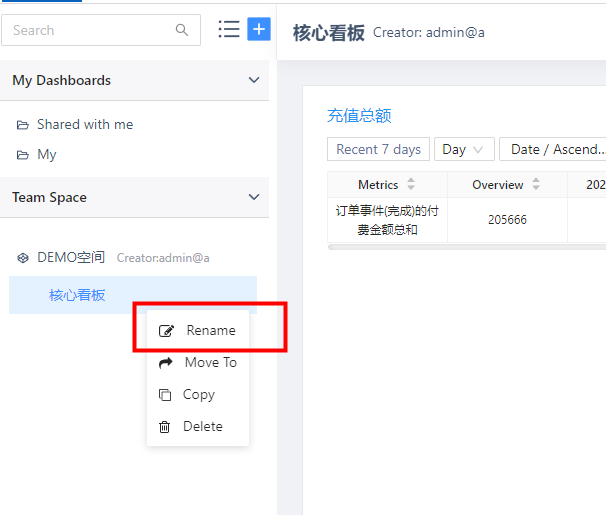
Mouse [right click] self-built
Dashboard, select “rename”, you can
rename the Dashboard.
Note: Shared
with Me is a preset section of the
system
and does not support renaming
operations.
3.1.3 Delete
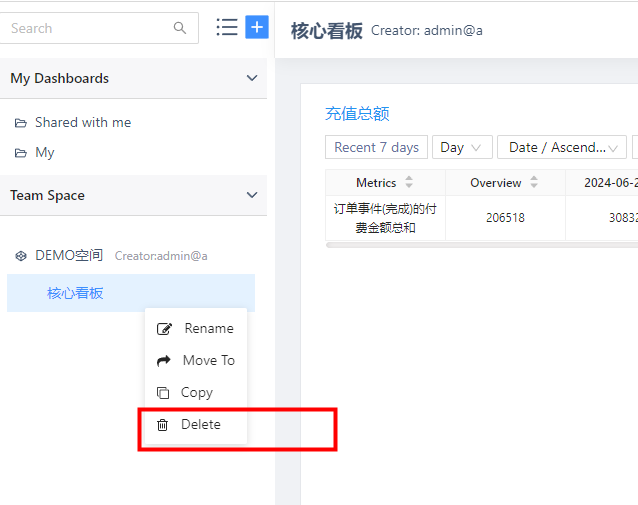
Mouse [right click] self-built Dashboard, select “Delete Dashboard”, you can delete Dashboard.
3.1.4 Dashboard movement
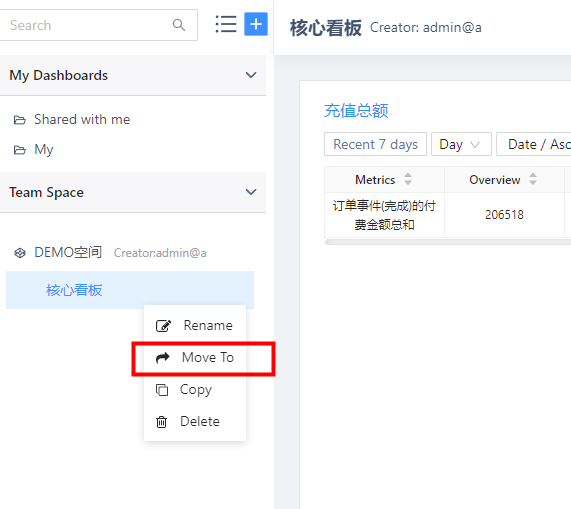
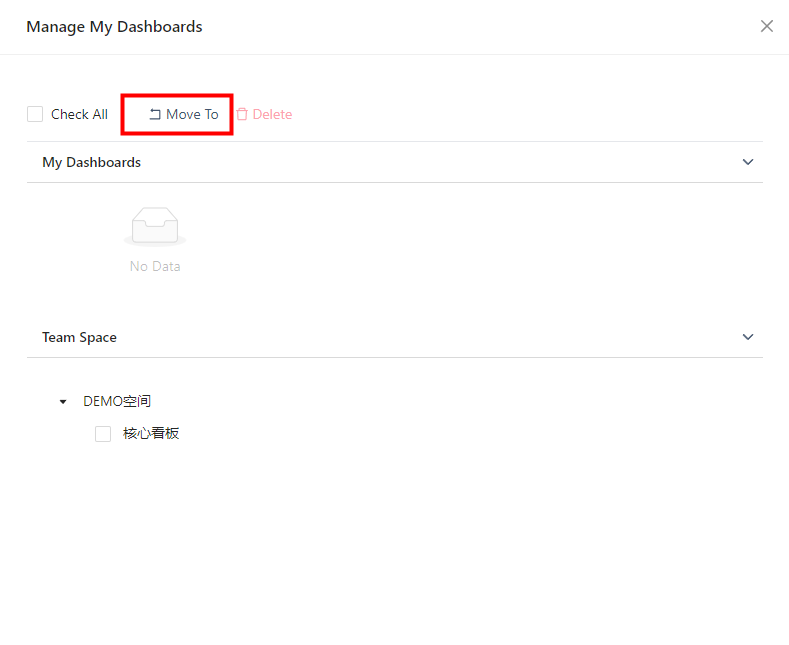
Mouse [right click] self-built Dashboard, select “Move to”, you can move to the space or my Dashboard, you can also click “management”, Dashboard batch processing.
3.2 Manage Dashboard content
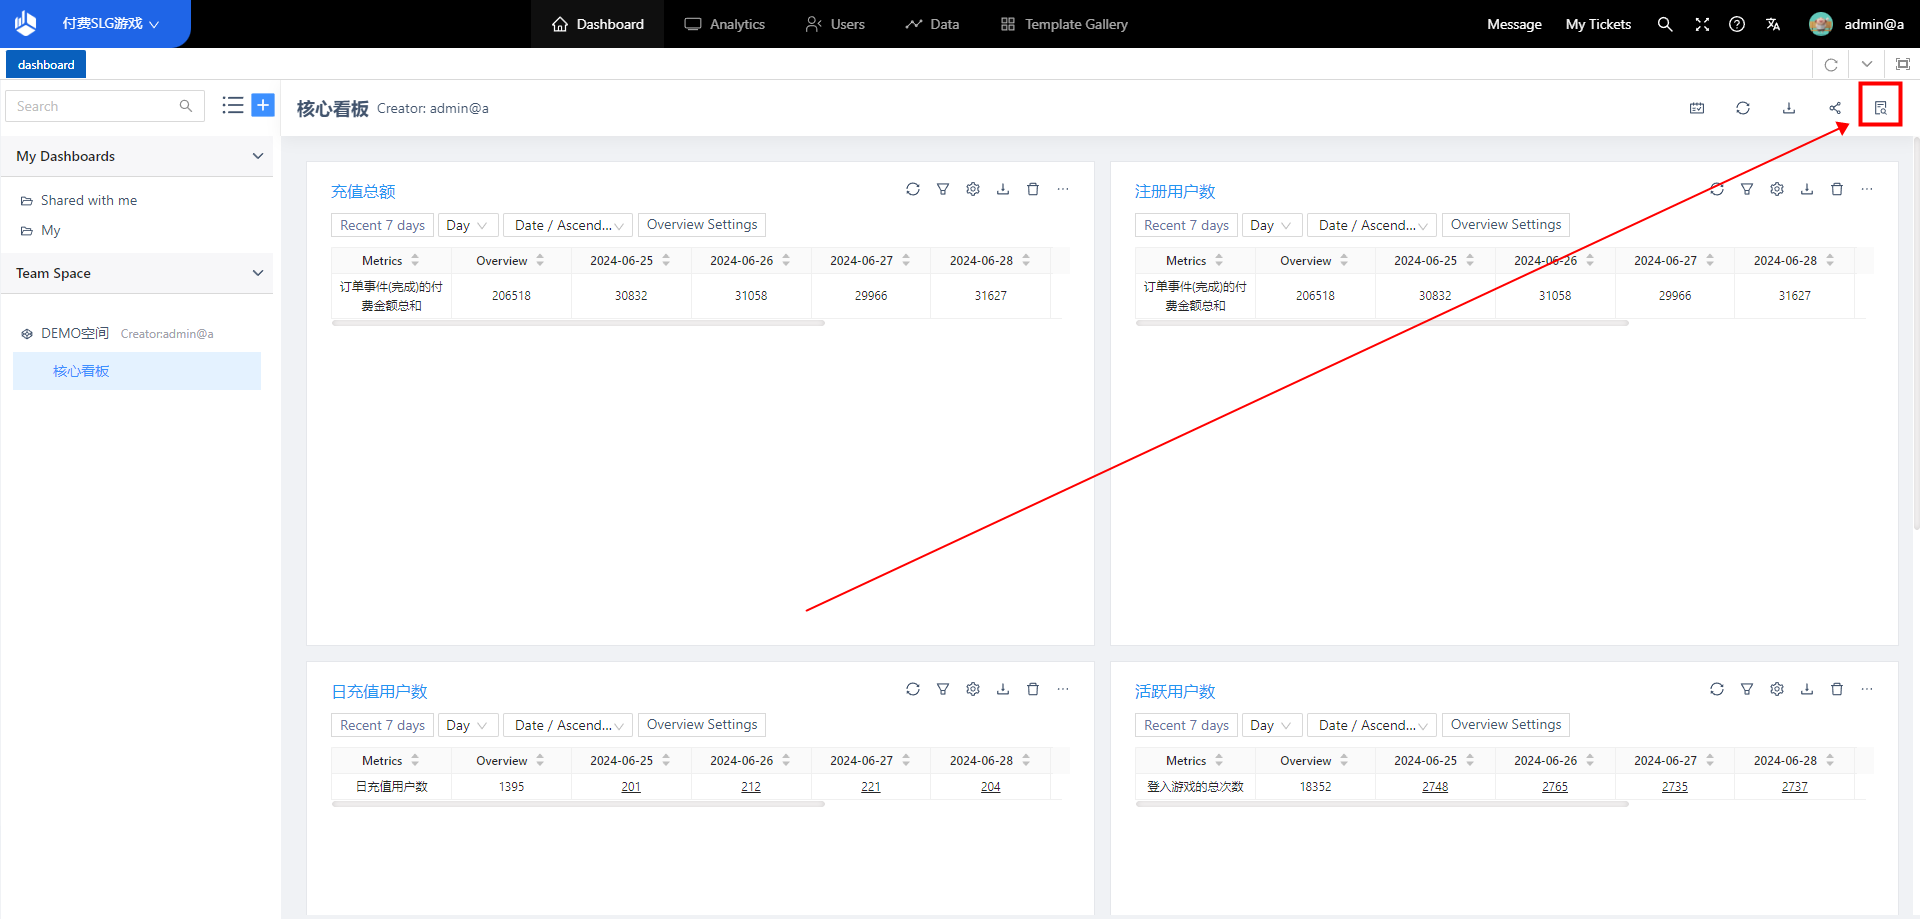
Click the button at the top right of the Dashboard and click the Settings button.
3.2.1 Add chart
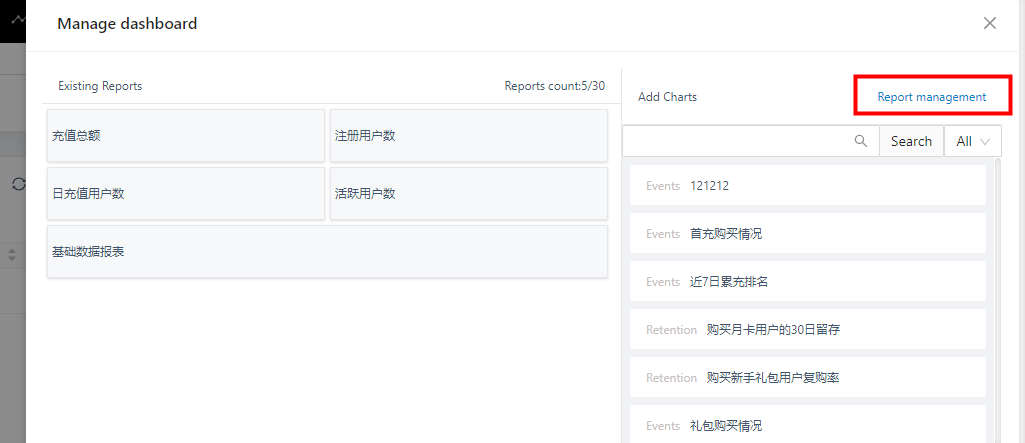
Click [+] on the right to add the report
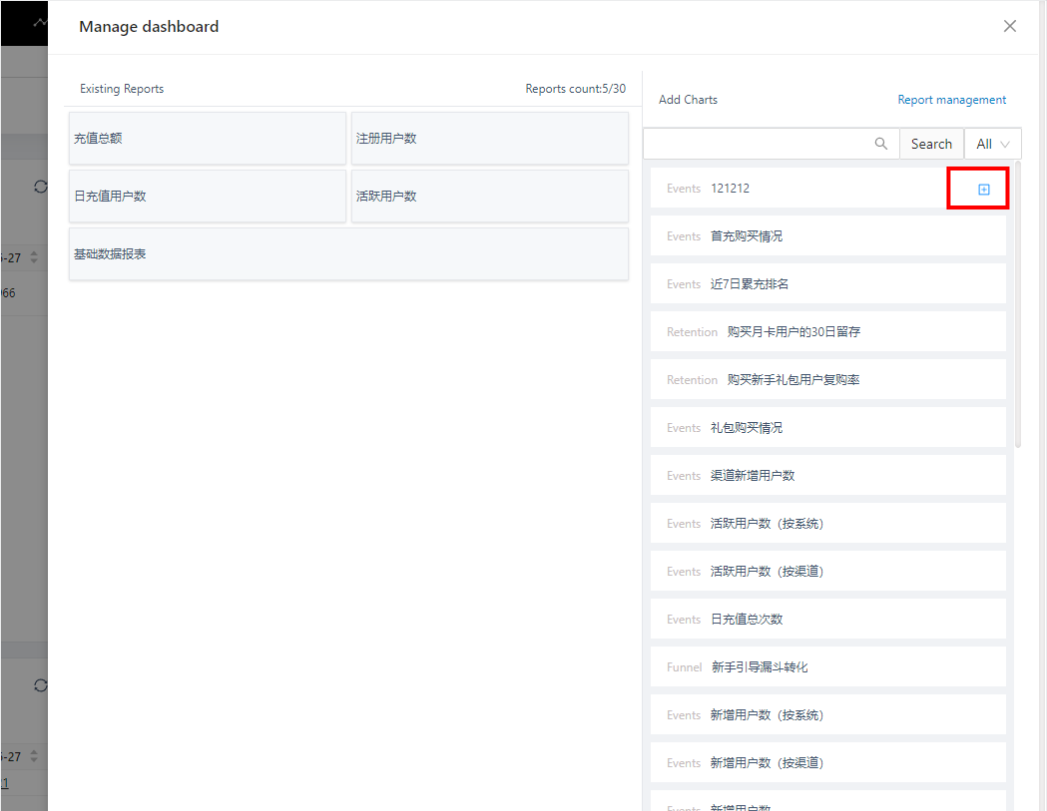
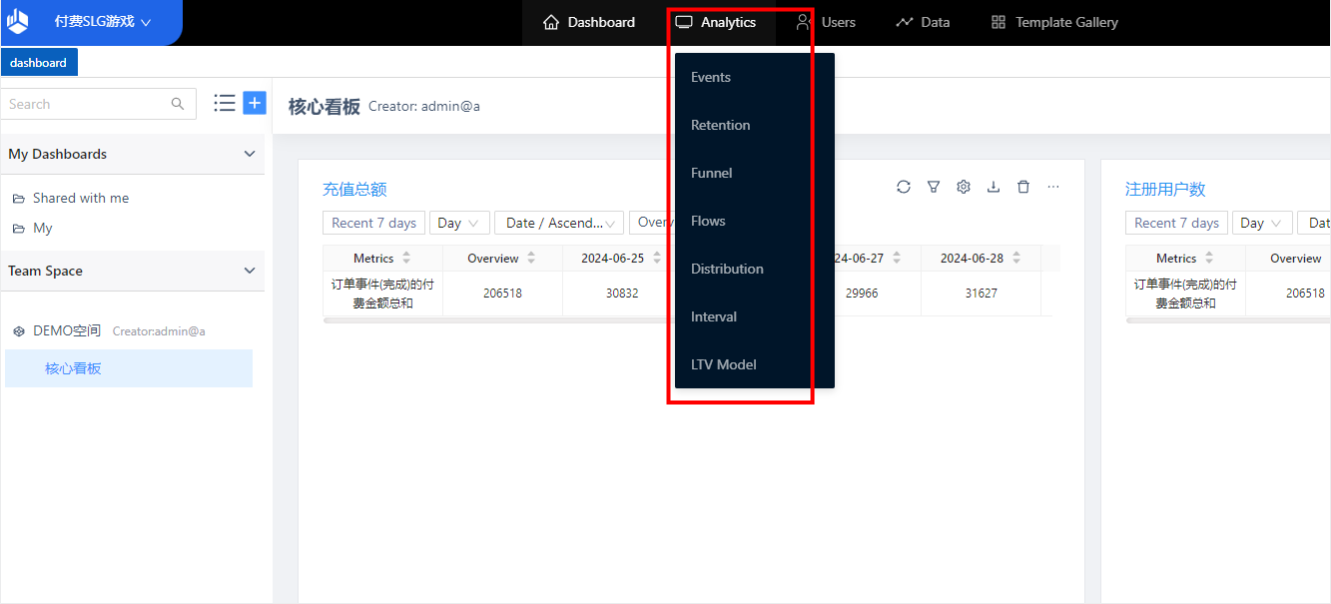
If there is no report, you can create one in Report Management or Behavior Analysis
· Report management
· Behavior analysis
3.3 Dashboard sharing
The platform supports sharing self-built Dashboard with other members of the team to jointly view Dashboard and achieve collaboration among team members.
3.3.1 Set Dashboard sharing
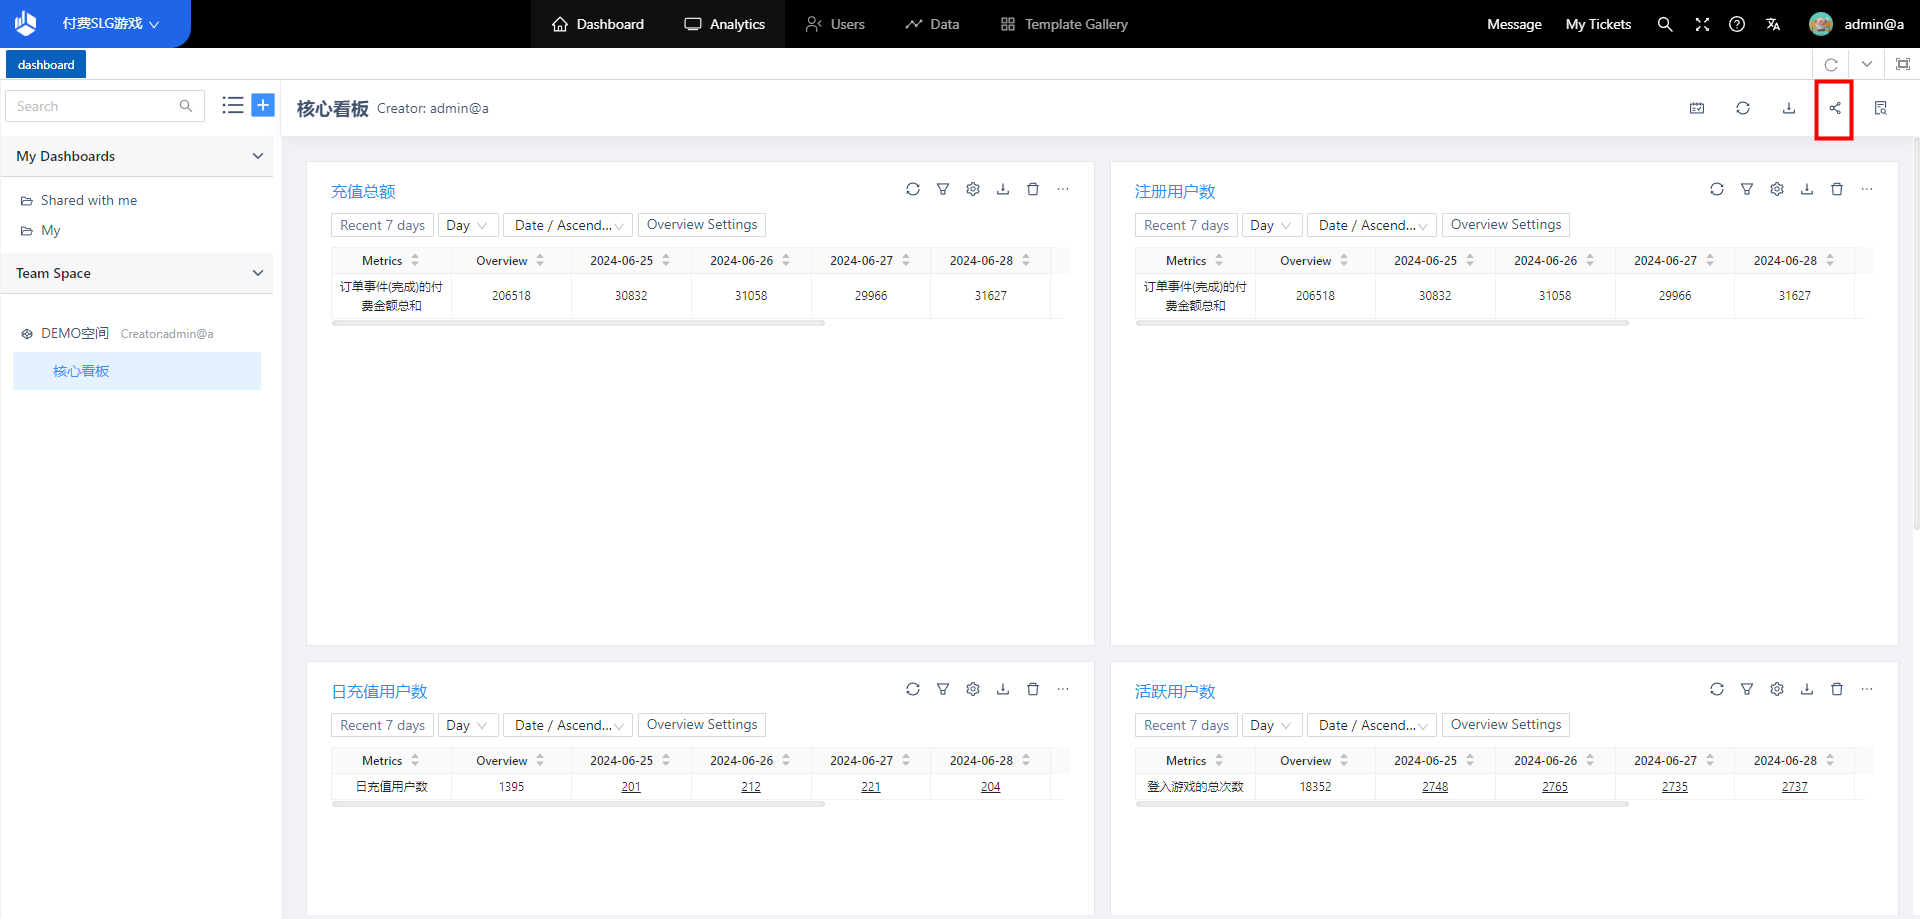
Click the “Share” button on the upper right of the Dashboard to enter the Dashboard sharing Settings
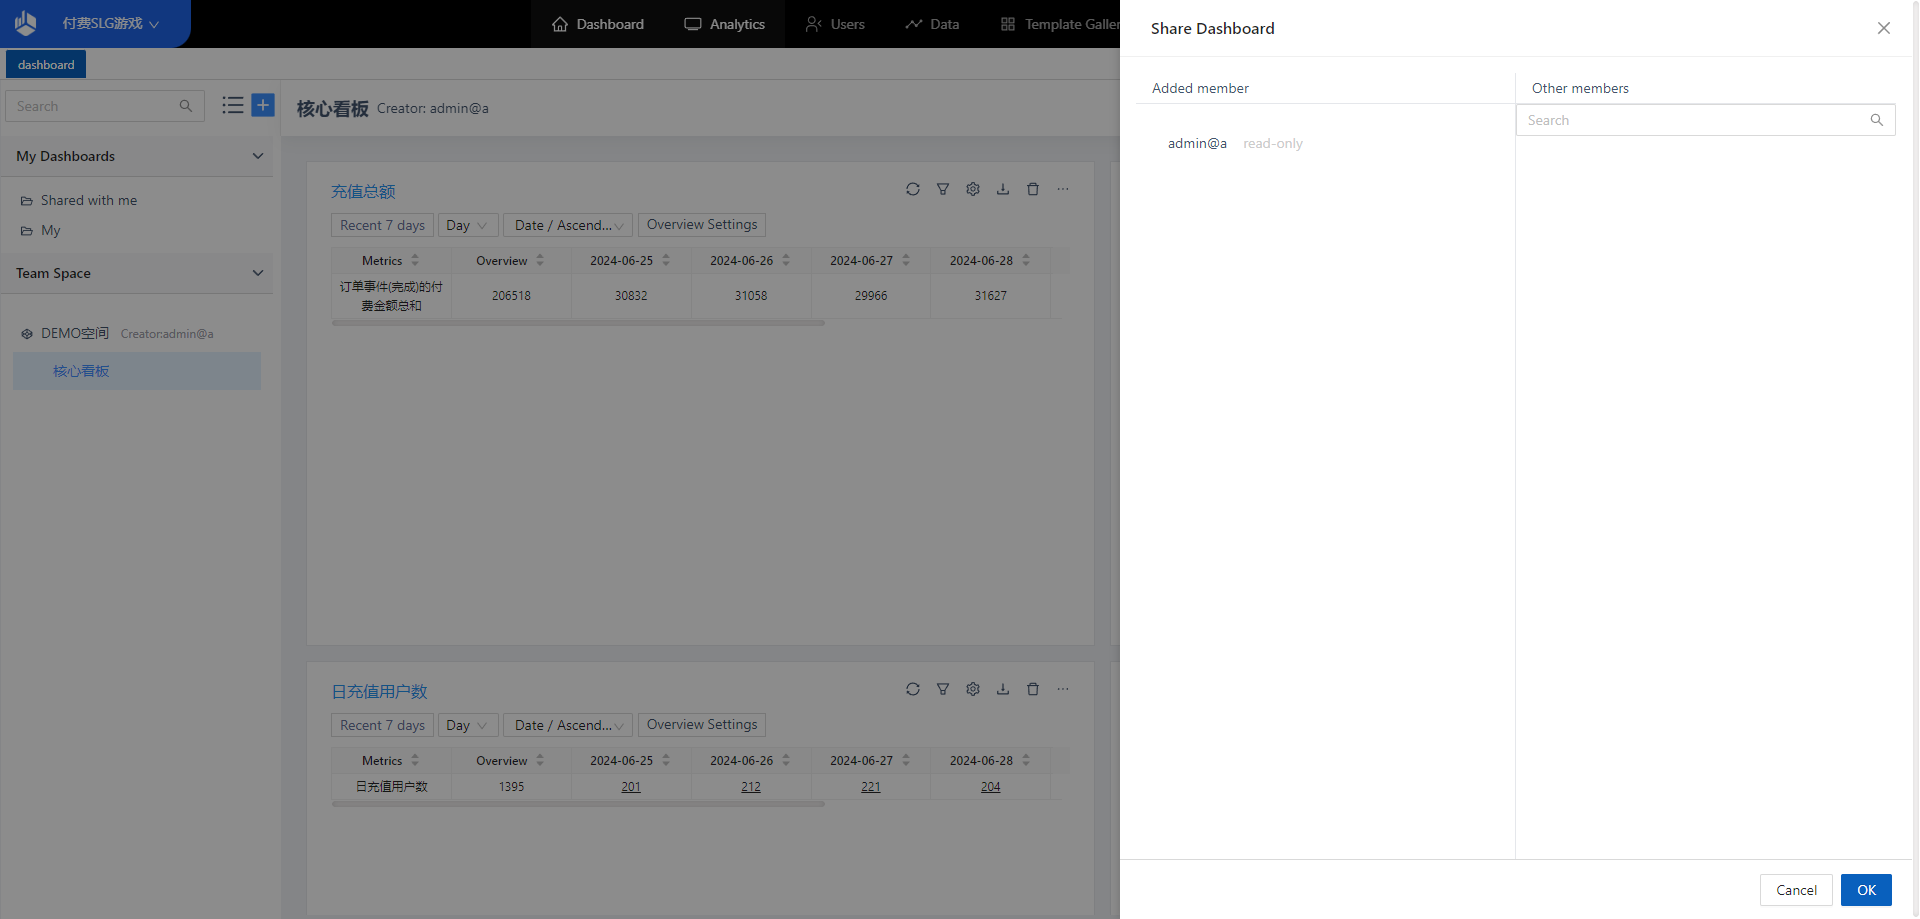
By default, Dashboard is visible only to yourself. Click [+] to add the shared object of Dashboard.
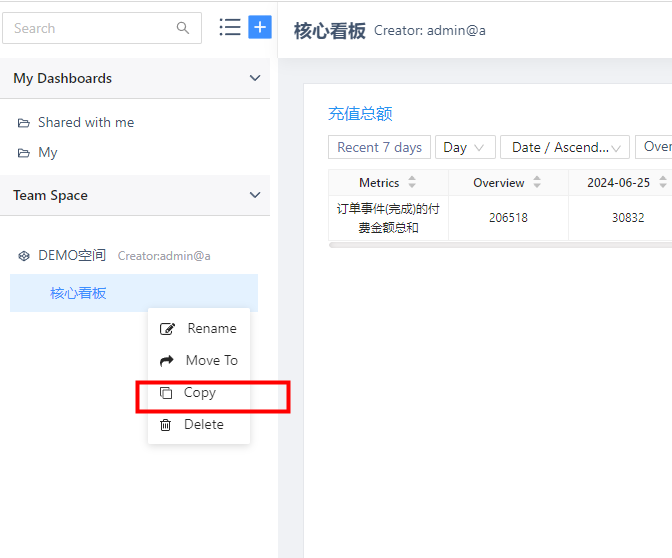
3.4 Duplicate Dashboard
In the process of using
Dashboard, if you want to make further
analysis and adjustment on the basis of
a Dashboard, you can use the copy
Dashboard function. By default, the
supermanager, administrator, and analyst
have the operation rights to copy
Dashboard.
Mouse [right click]
Dashboard,
select “Copy Dashboard”, you can copy
Dashboard.
· Copying the Dashboard
will
copy all the charts in the Dashboard at
the same time
· The shared status of
the copy Dashboard is “visible only to
yourself” by default.
3.5 Global filtering
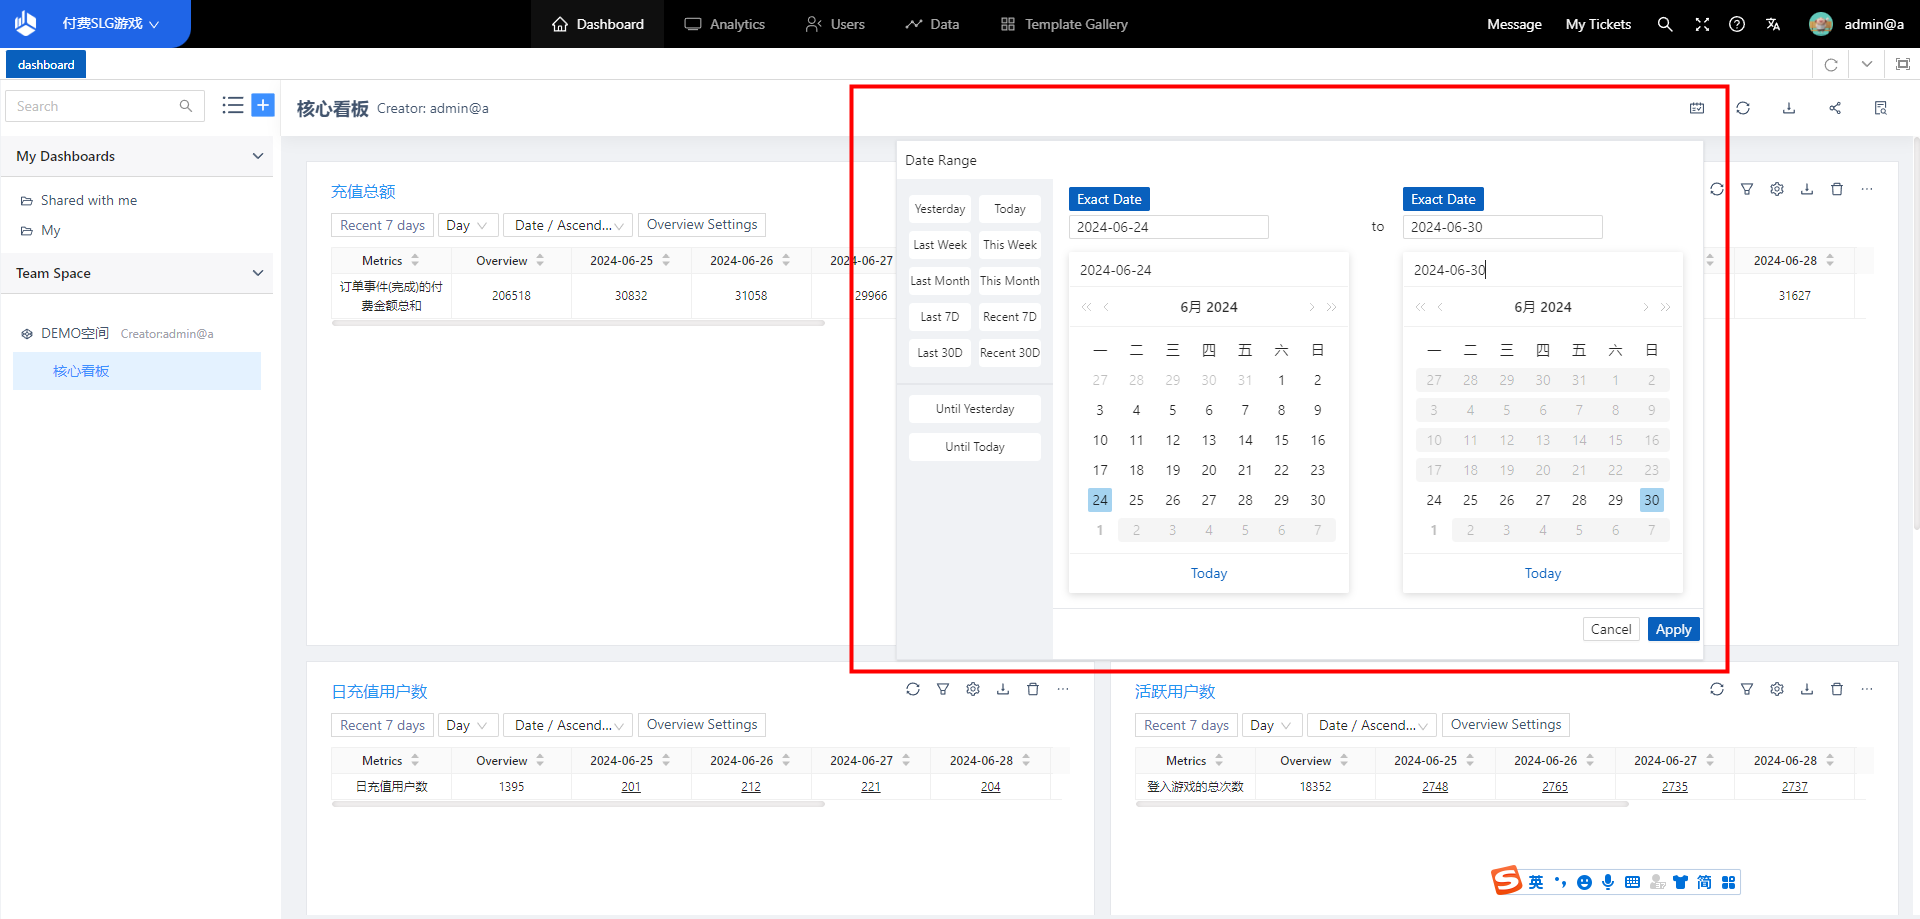
3.5.1 Modified analysis time
You can change the time frame in
any state. The data granularity is
day.
After selecting the time,
execute the command in the following
order:
1、To change the display
content of the global time
frame
2、After
the calculation is complete, the time is
changed to the same as the global time
box and the report results are displayed
3.5.2 Scenario in which the time frame is modified
1、When the overall time frame is
adjusted, the time frame of each
Dashboard report on the page is adjusted
temporarily and the result is
re-calculated
2、Modifying the content
of a Dashboard report and recalculating
the report does not affect the overall
filtering conditions
3、When you log
out or switch Dashboard, the time box is
cleared
4、When refreshing Dashboard,
the time box options are not cleared
3.6 Bulk download
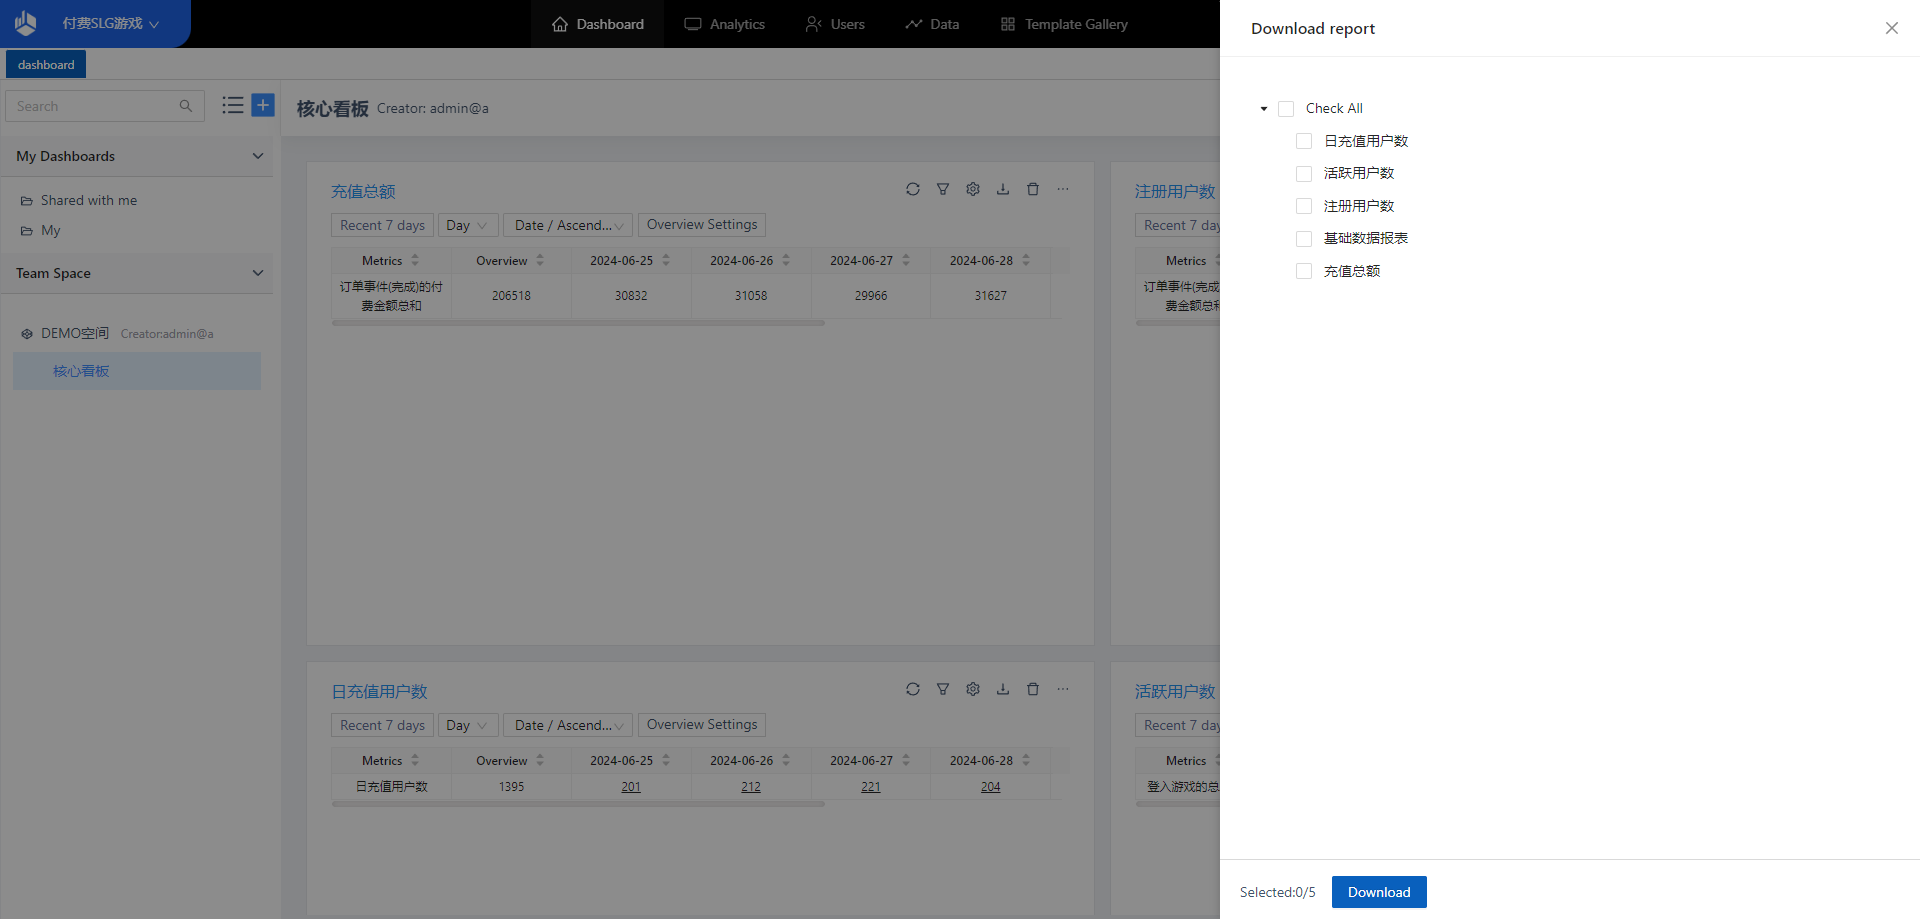
Download the corresponding chart data in Dashboard in batches. Each chart corresponds to a csv file.
4. Guidelines for the use of project space
4.1 Project space usage scenarios
After you set up Dashboard sharing under [My Dashboard], the Dashboard will be displayed under [My Dashboard] → [Shared to me]. With the deepening of the use of the system, the number of Dashboard in the project is increasing. At the same time, it brings difficulties to the Dashboard creator to set up Dashboard sharing, the sharing status management of Dashboard, the classification and sorting of the shared Dashboard by the shared people, and the Dashboard collaboration among team members. Using the function of project space, we can realize the batch sharing of Dashboard and the unified classification and sorting of Dashboard shared by many creators. Achieve the unity and structure of team Dashboard view, so that the communication and cooperation between team members is more efficient and convenient.
4.2 Create/Edit space
4.2.1 Create space
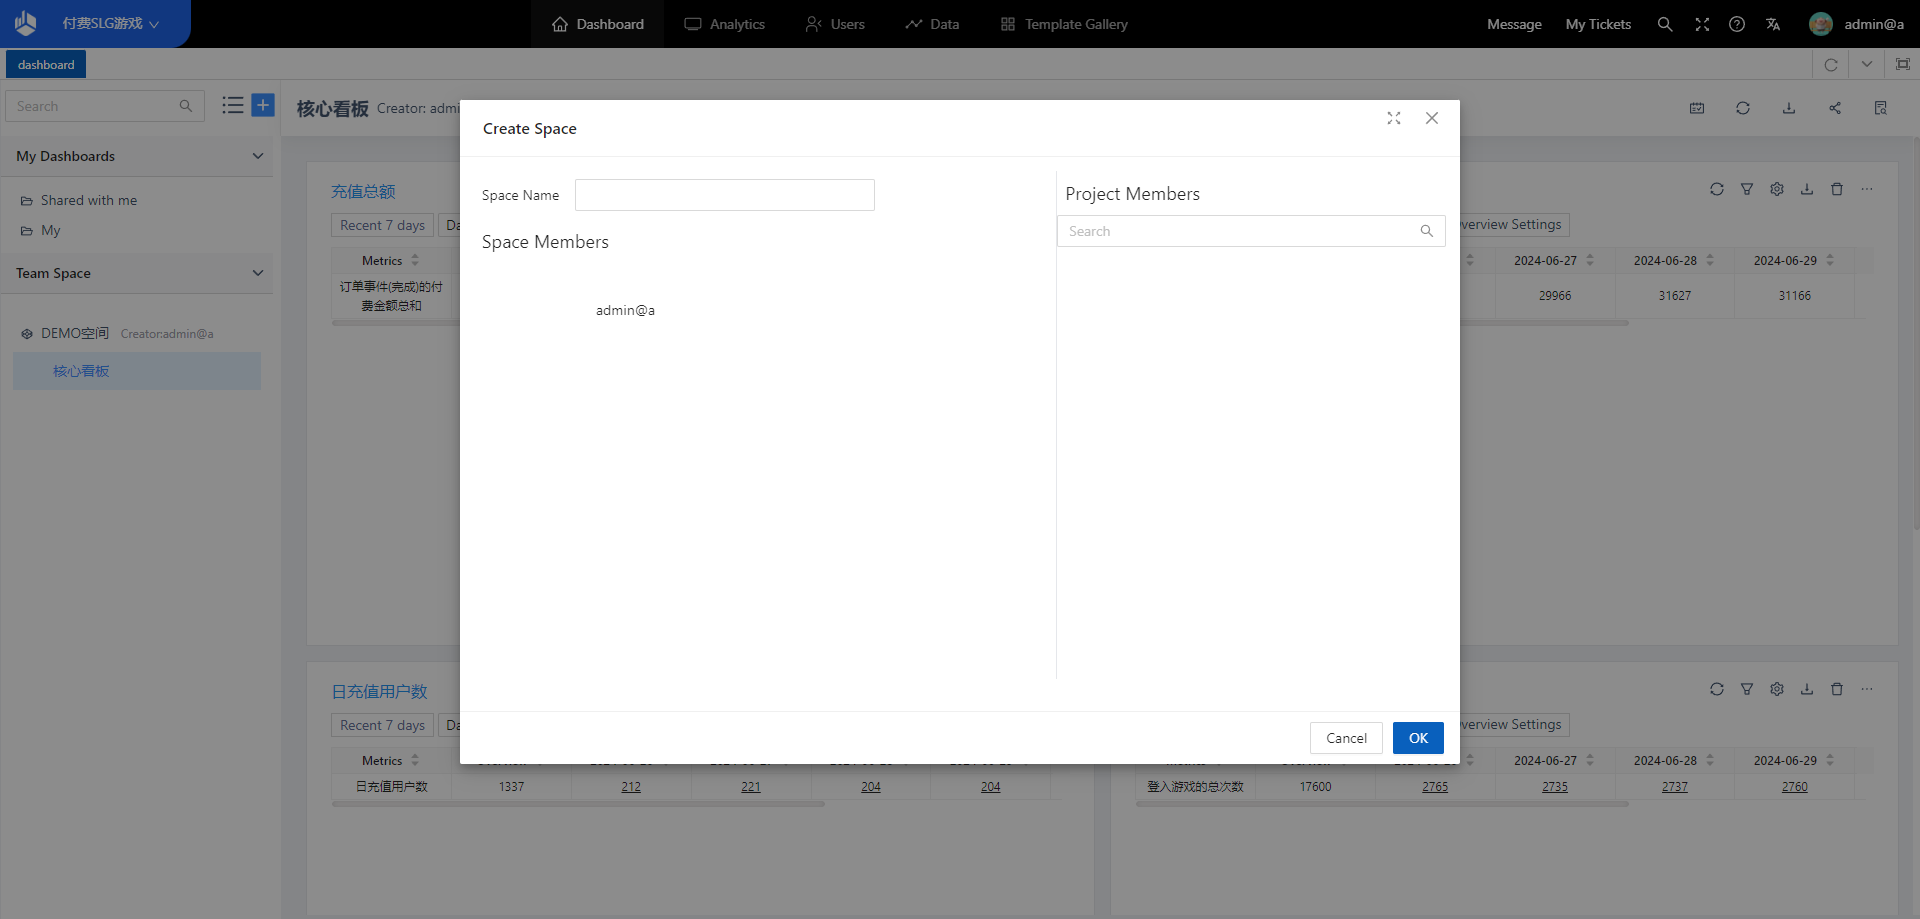
You can click [+] in the left column of Dashboard and select “New Space”. By default, the administrator can create space.
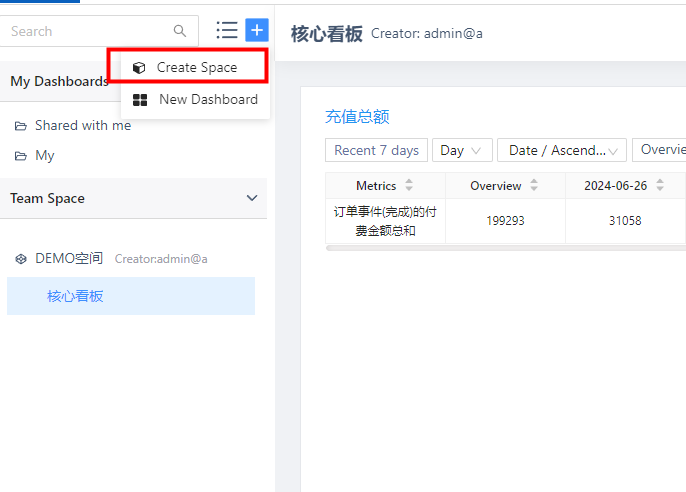
Select a space member and set the space member permissions in the Create Space TAB. In-space Dashboard is visible to space members by default.
4.2.2 Edit space
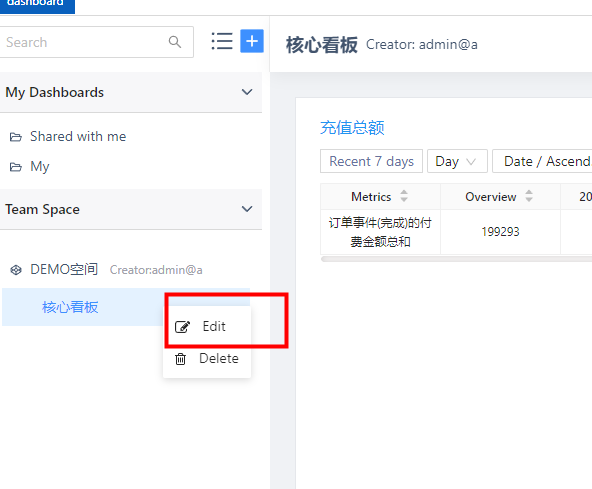
Mouse click […], select “Edit space”, you can edit the space.
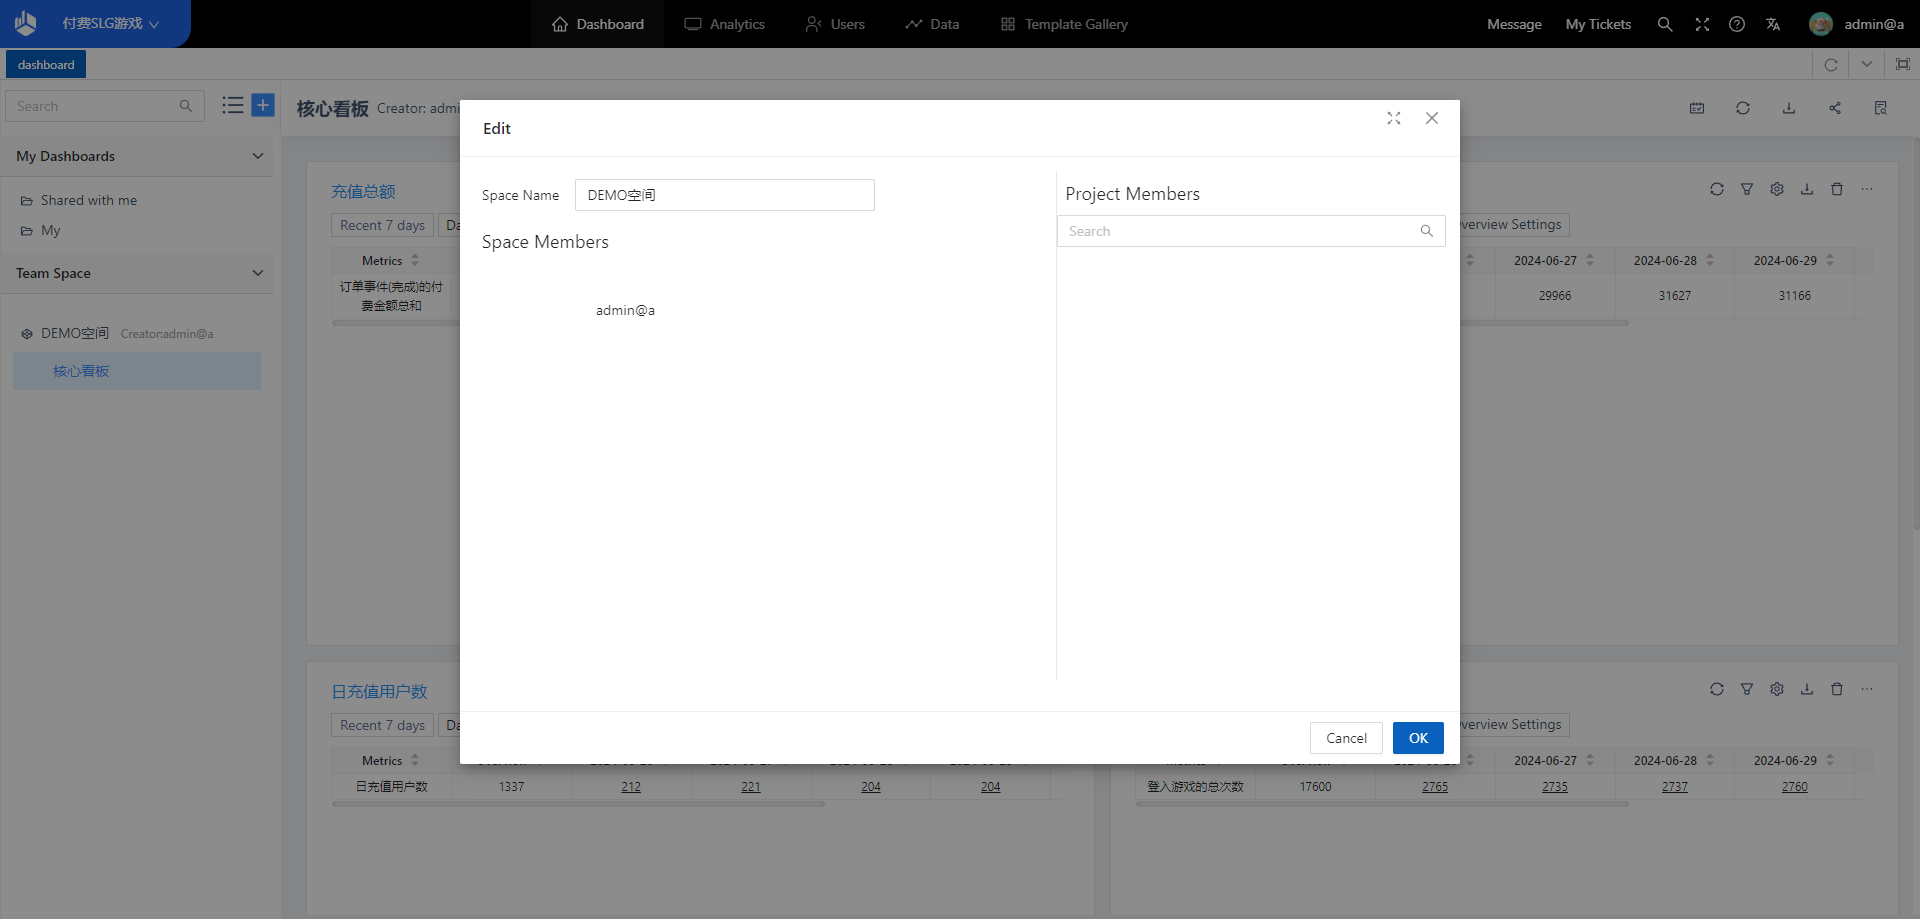
The space creator can edit the space Settings, including modifying the space member list and changing the space name
4.2.3 Delete space
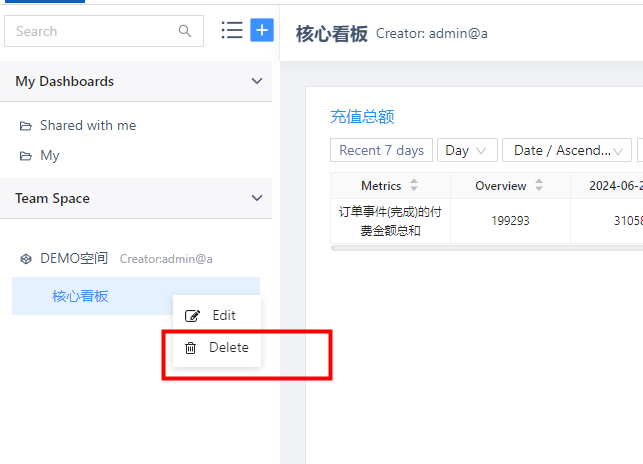
Mouse click […], select “Delete
space”, you can delete the
space.
Deleting a space does not
delete the Dashboard directly, after
deleting, the Dashboard under the space
will be moved to the Dashboard creator
[My Dashboard] folder.
4.3 New space signage
4.3.1 Create a new Dashboard directly into the space
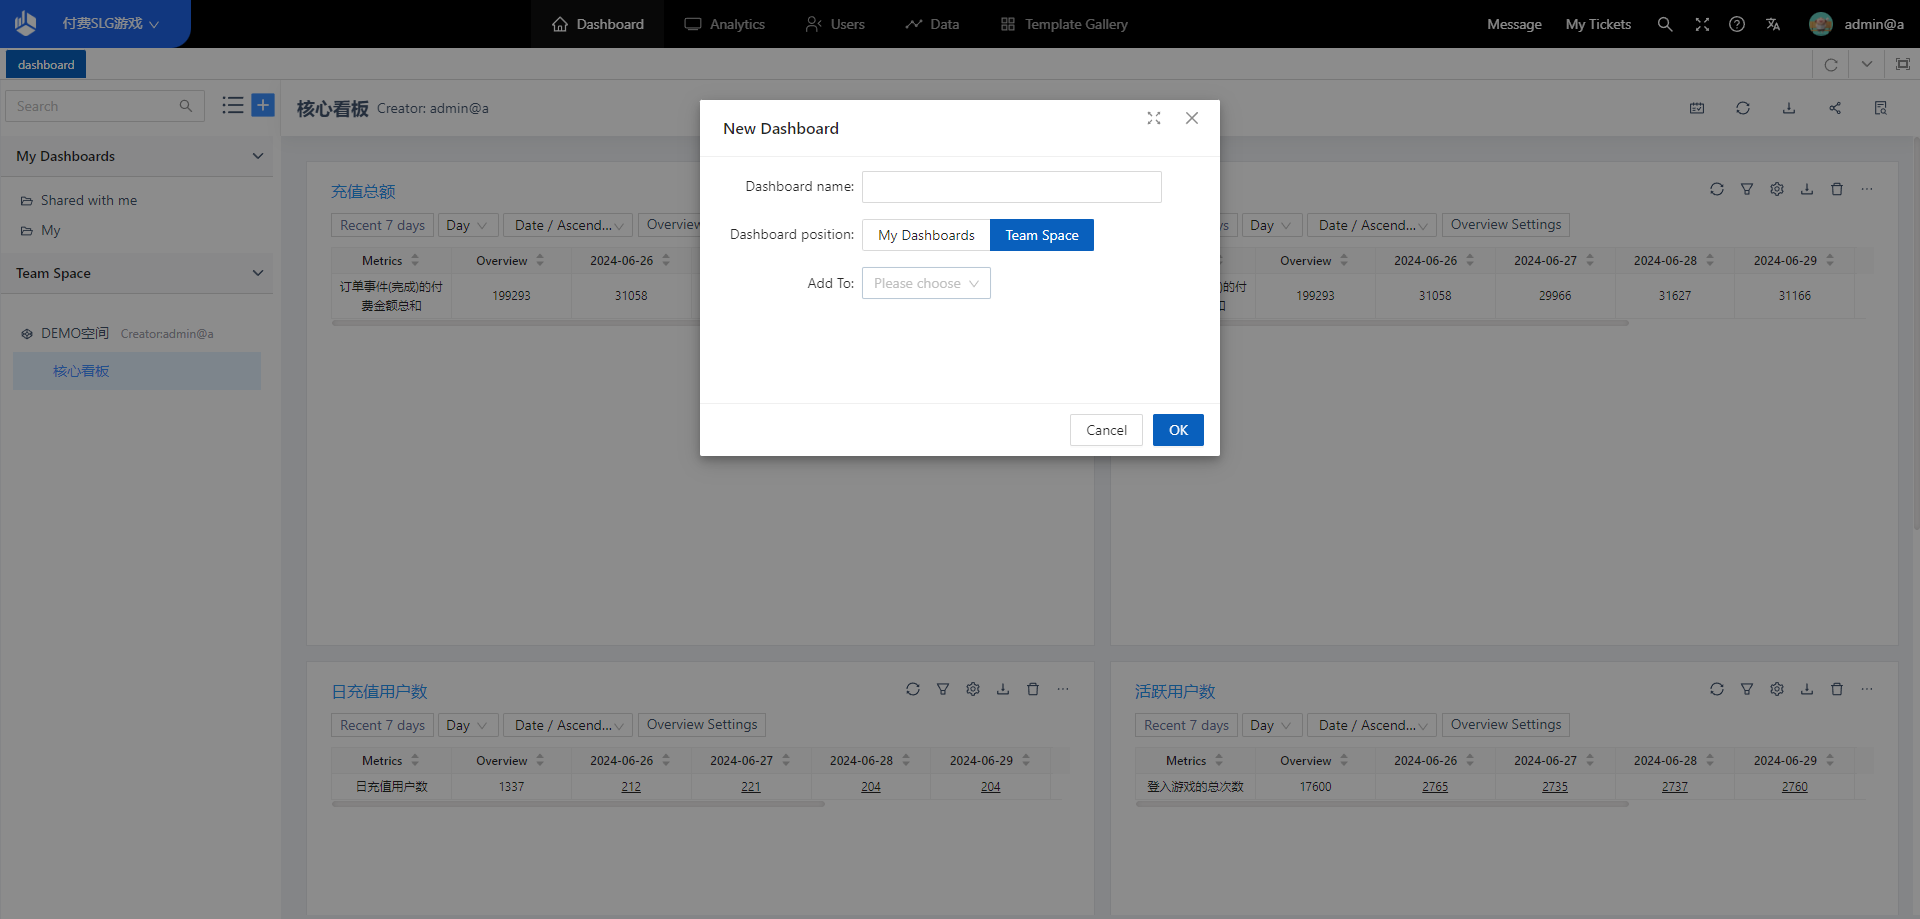
Click [+] in the upper right corner of the left column of the Dashboard and select “New Dashboard” to save the Dashboard directly to the space where it is located.
4.3.2 Move self-built Dashboard to space
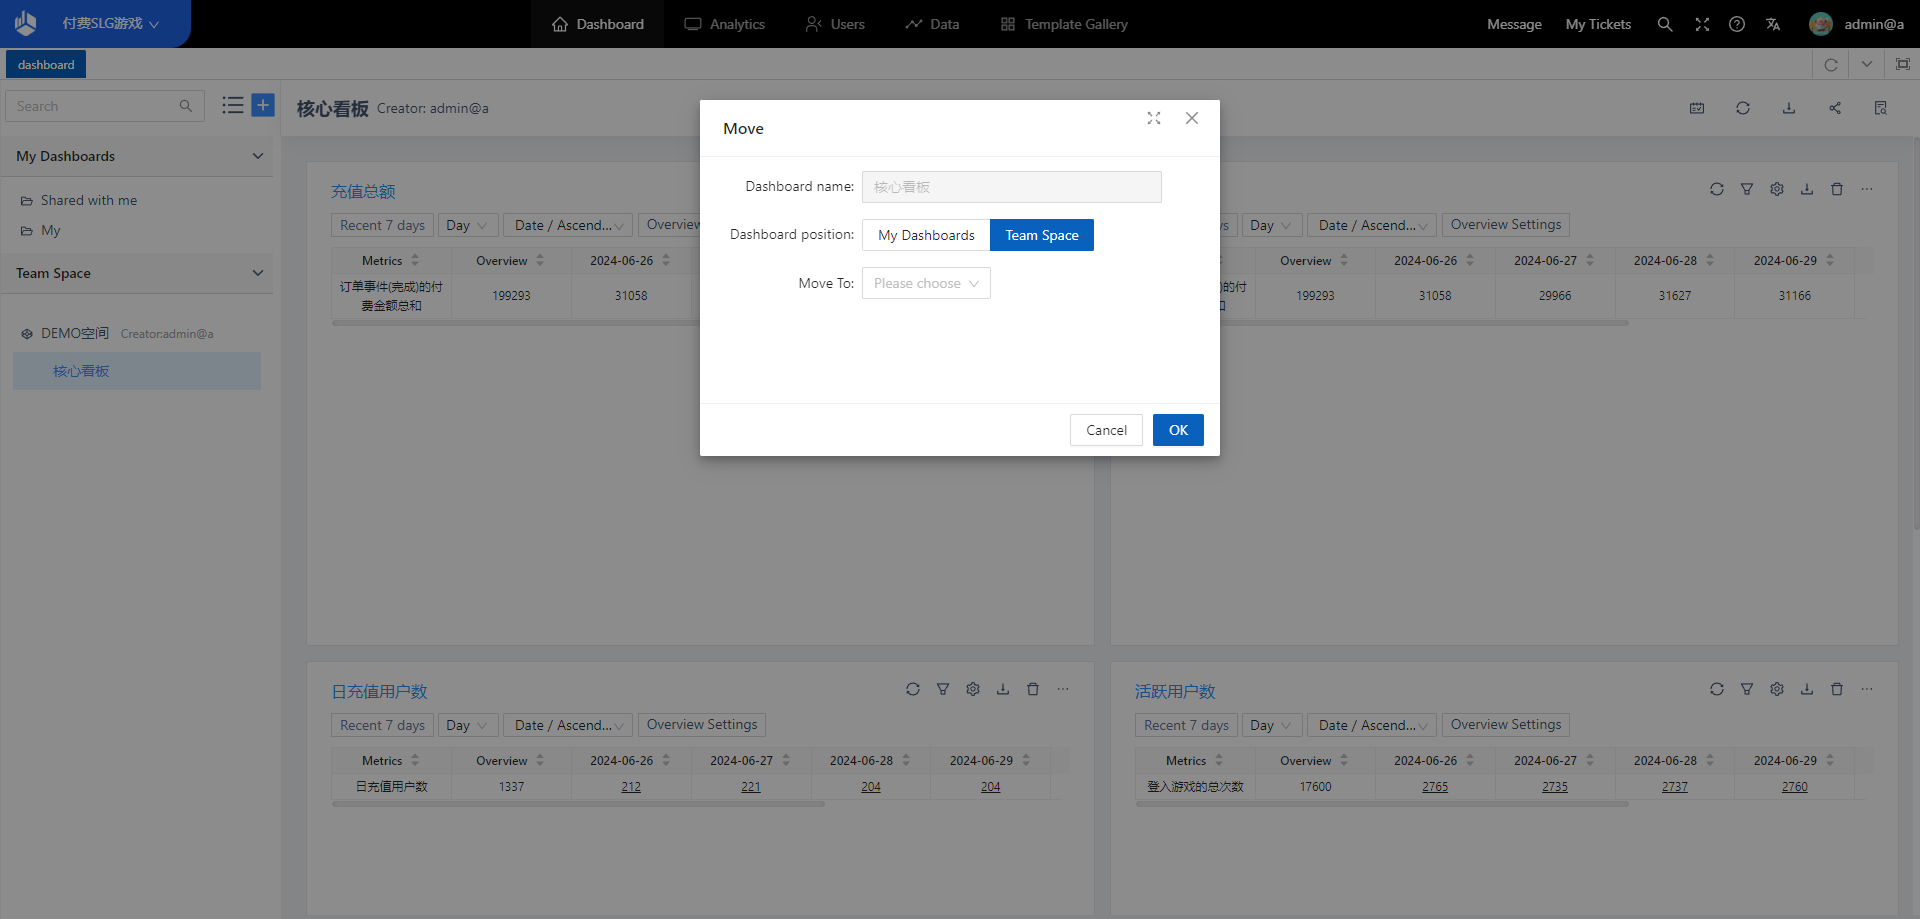
Click the Dashboard […], select
“Move to”, you can directly move the
Dashboard to the space.
Note: Moving
the Dashboard does not change the
sharing Settings of the Dashboard (i.e.
the sharing status in the upper right
corner [Dashboard sharing Settings] does
not change with the movement of the
Dashboard)
5. Dashboard management
5.1 Batch move or delete your own Dashboard
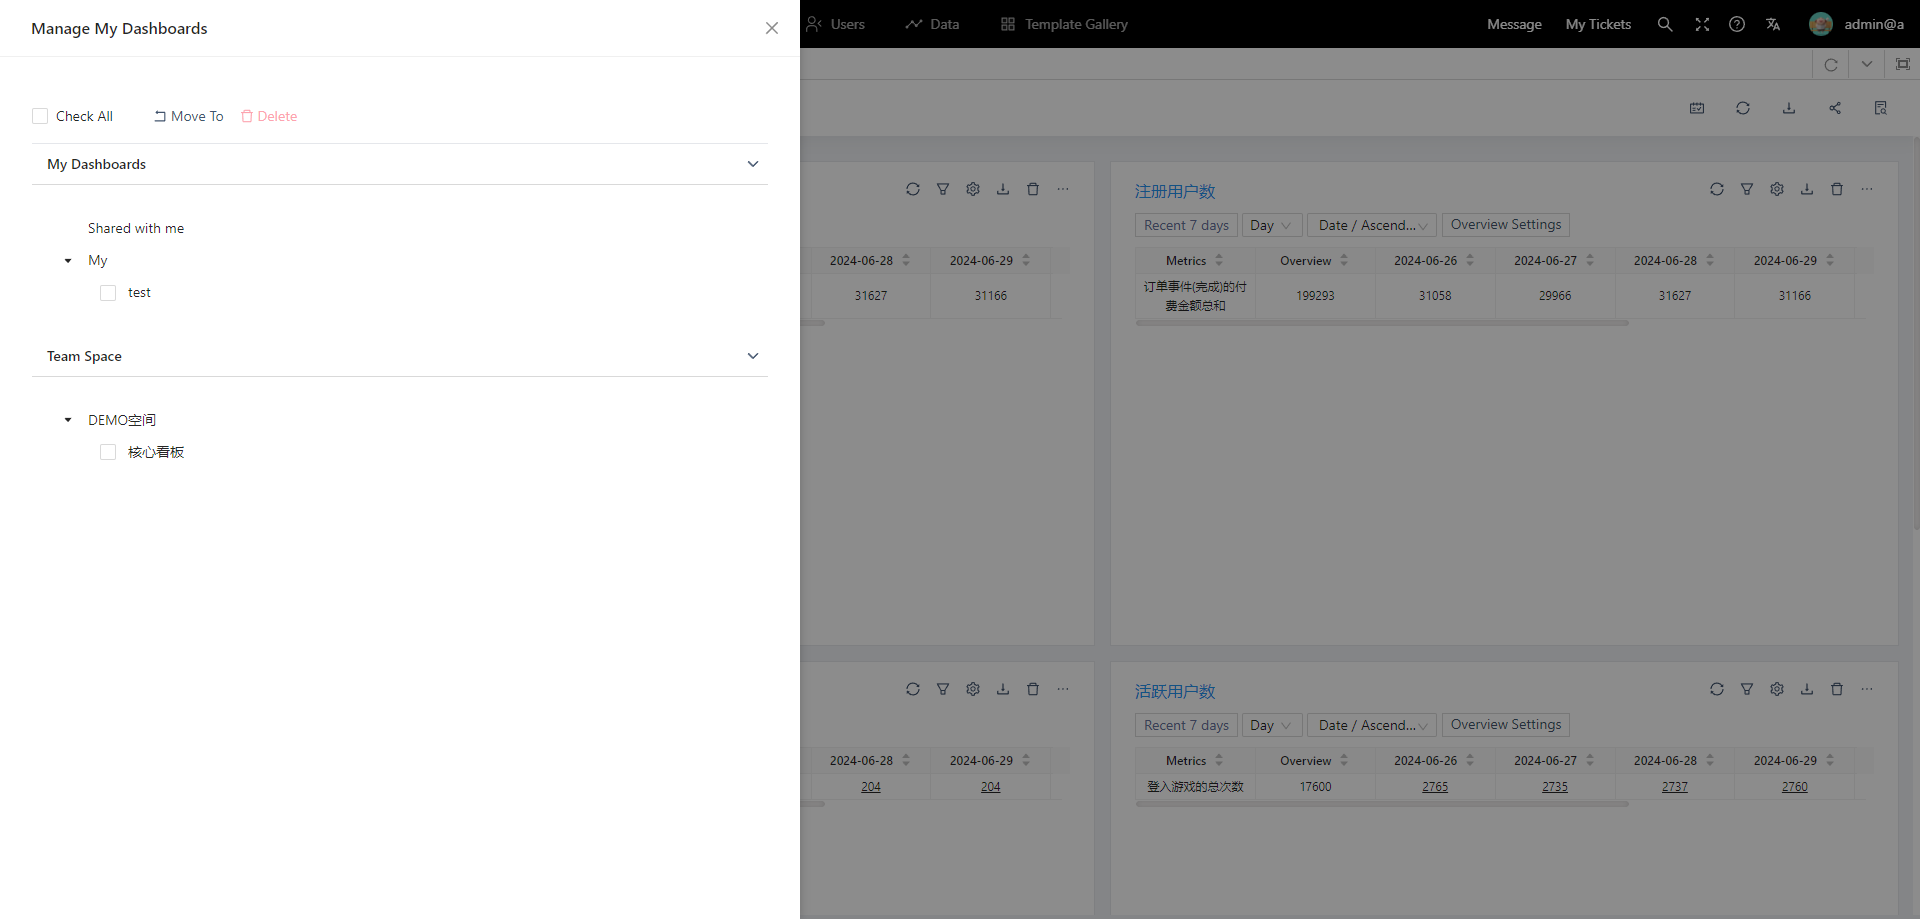
Click on the upper right corner
of the left column of Dashboard
[Dashboard management] to open the
Dashboard management pop-up window,
which
supports batch movement or deletion of
self-built Dashboard.
· Only batch
management of self-built Dashboard is
supported
· You can batch move your
self-built Dashboard to “My Dashboard”
or a project space with permissions
6. Dashboard chart
6.1 Dashboard chart composition
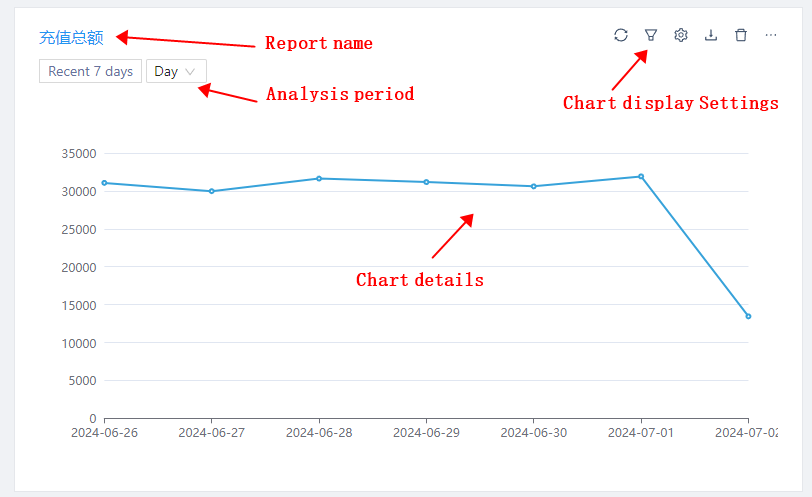
The Dashboard core area consists
of multiple Dashboard charts
(reports), and the form of the charts in
the Dashboard is not completely
consistent with that in the
model.
Any Dashboard chart consists
of a palette
and chart content, and depending on the
chart type (source), the options
supported by the palette vary.
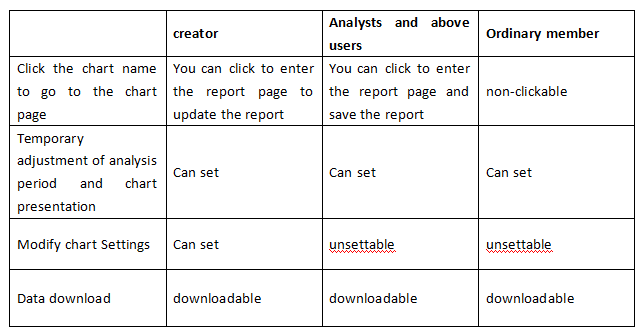
6.2 Operation rights of different roles on the Dashboard chart
三、Analysis
Event It represents a certain or a series of meaningful behaviors of users, such as registering an account, purchasing gift packages, etc. Through behavioral analysis, the real use process of users can be restored, which is an important part of game data analysis. For different analysis scenarios, this platform provides a variety of analysis models, you can choose according to the actual situation.
Events is the most basic model, which can calculate the aggregated metrics of user’s specific behaviors over a period of time, or the trend in metrics, such as whether the number of daily active uses (DAU) remains steady, how much today’s revenue is, etc.
Retention analyzes the retention rate, one of the KPIs. By selecting the trigger and return actions, you can get the new user’s retention rate at the second, third or seventh day easily. You can also calculate the LTV and ROI by “Calculate another metric”.
Funnel is used to analyze the number and percentage of users who complete specified steps in order. This enables you to quickly know the conversion or churn rate at specific steps, such as points to leave newbie guide or level stay data, and find possible problems.
Distribution divides intervals based on user participation. You can divide by the frequency of participation, number of days, etc., or by the sum of specific property of each user, such as the cumulative payment amount, and view the number and percentage of users in each interval.
Flows is generally used for exploratory analysis. You can visualize the inflow and outflow of users before and after key points through Sankey diagrams, and analyze user’s behavioral preferences, such as which activities users engage in first after logging in each day, or the key play pattern used by users before their loss.
Interval can analyze the conversion duration between two events in causal relationship, such as the median conversion time spent from registration to first payment, or the distribution of time spent in building upgrading. It can also be used as a supplement to funnel analysis.
LTV It is an analytical model that analyzes the business value of users, which can analyze the per capita value contributed by the user group visited on a specific date over a certain period of time.
That’s a brief overview of what behavior analysis covers, and you can click through to each chapter to learn more. If you are interested in user analytics, check out user analytics.
1.Events
1.1 The significance of Events
The behavior data generated by the USER in the APP or game is called the EVENT, and the event data records the time, type and detailed information of the user’s various behaviors. The model that filters or groups these event data and finally calculates aggregate metrics is called the event analysis model.
Through event analysis, we can calculate aggregate indicators of specific behaviors generated by users in a period of time, understand the user participation of each behavior and the development trend of indicators, so as to obtain macro control of products and optimize decisions.
In the case of consumption events, for example, the following problems can be solved:
- What is the daily income flow trend in the last month?
- The daily income flow and distribution of each channel in the last month?
- For users from Shanghai, what is the trend of the amount paid per capita in recent month?
- How do users from Shanghai and Beijing compare the total number of times they paid for membership cards in the last month?
1.2 Location of Events
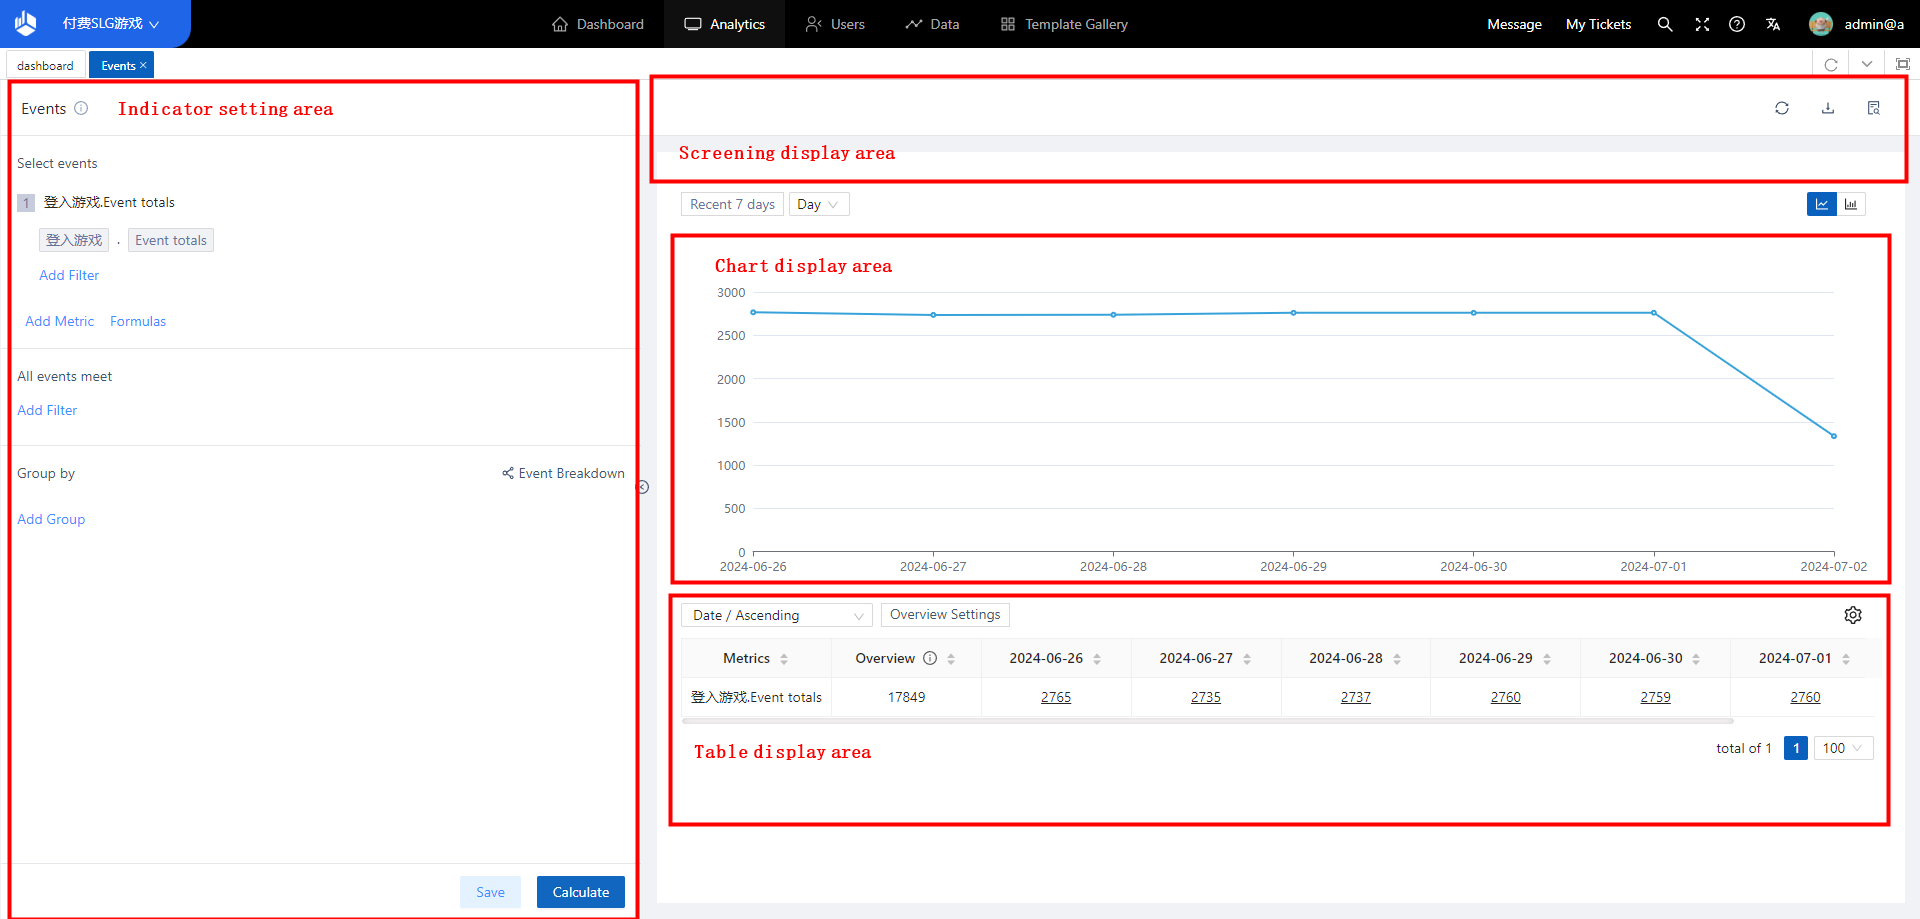
Select “Analysis” from “Events” in the top navigation bar to enter the Events model:
1.3 Use of Events
1.3.1 The selection of analysis indicators
The analysis indicator is
“event” + “attribute” + “calculation
method” or directly “Event” +
“calculation method”.
For example:
the number
of users triggered by any event, the
number of per capita purchases of goods,
the average VIP level of users who buy
goods, the number of users who buy goods
using WIFI is true, and the number of
de-replications of users who buy goods
in
provinces.
1.3.1.1 Additive formula
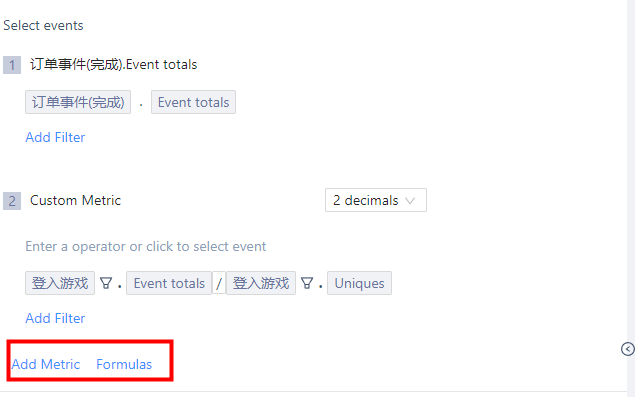
If you need to analyze some of the four operations between indicators, you can do it by “adding formulas”. For example, the ARPU value (the amount paid per active user) can be analyzed with the “order event.” Total order amount. Total “/“ Login game. Trigger user number”

1.3.1.2 Add multiple metrics
You can analyze multiple analysis indicators at the same time by “Add Indicators” to achieve some comparison and display requirements, as shown in the following figure:
1.3.2 Selection of grouping items
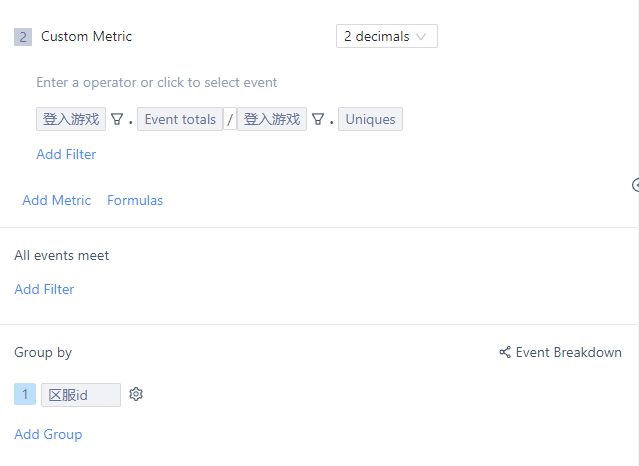
Group items can be grouped by
user attributes, event attributes,
user clusters, or user labels.
For
example, if the analysis index is “total
order amount of order event” and the
group Angle is “channel”, the total
order
amount of each channel can be analyzed.
1.3.2.1 Set the conditions for the specified group
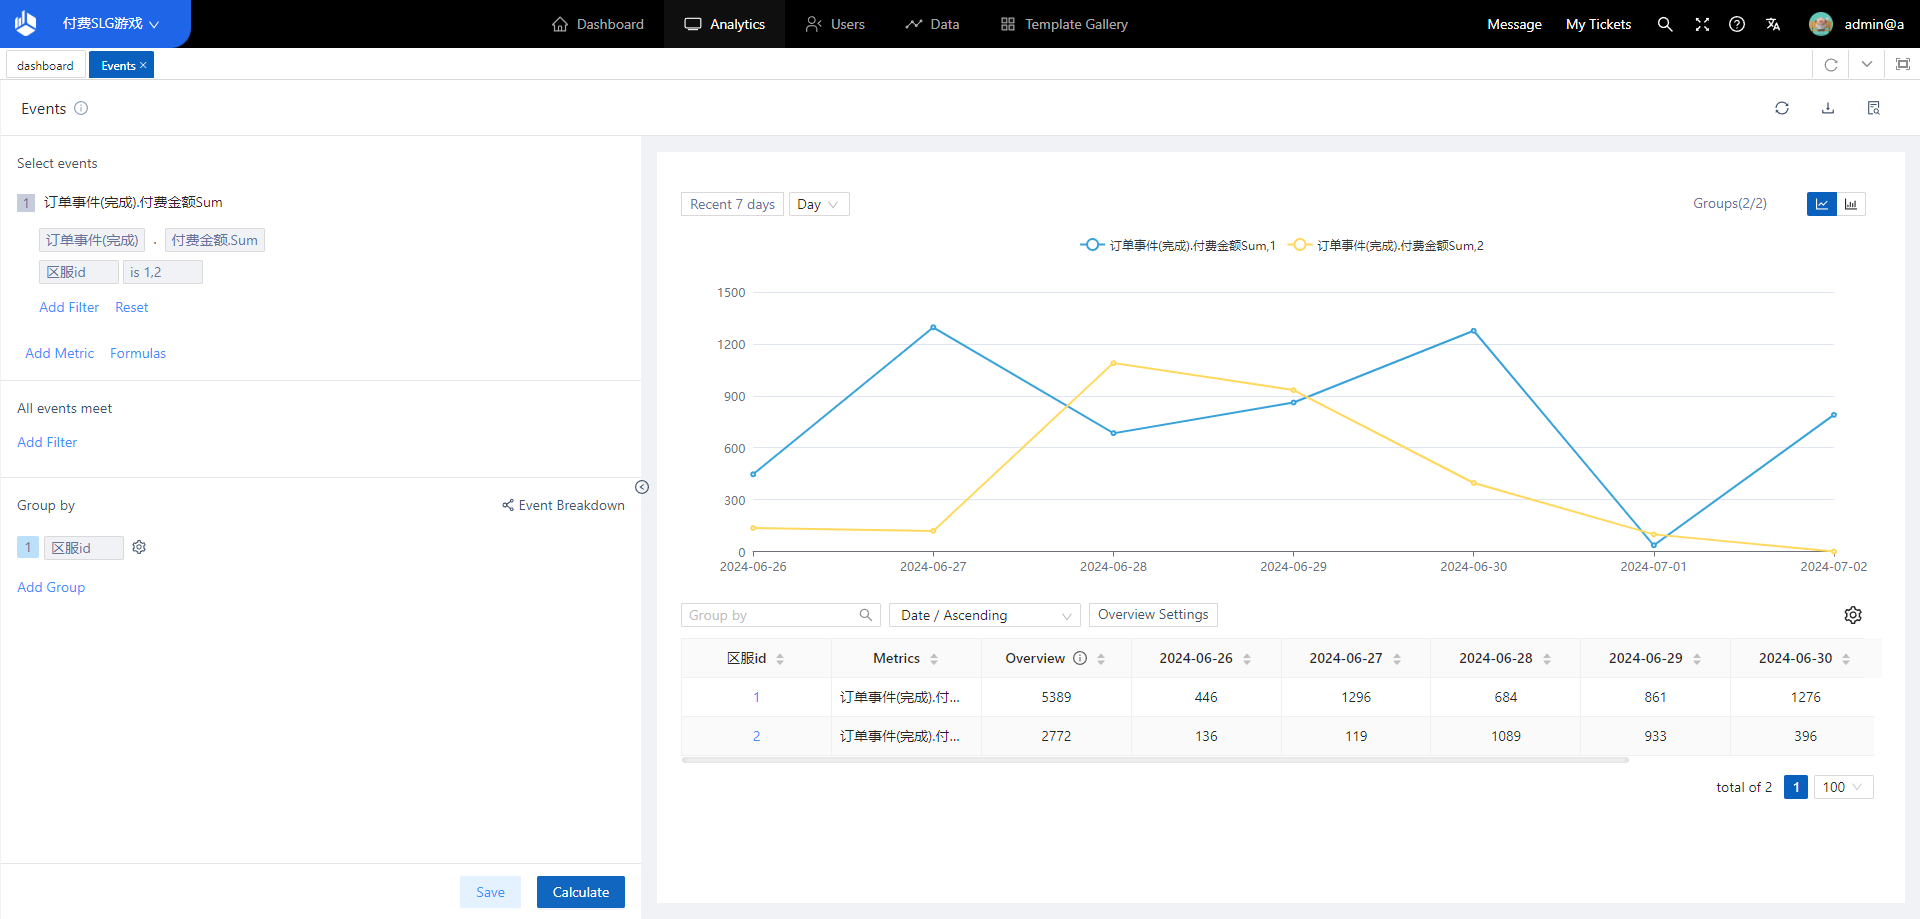
“Designated group” can be set by combining screening conditions. For example, in the above case, if “District service id” is equal to “1/2” in the screening conditions, “the sum of the respective paid amounts of 1 and 2 district service id recharge events” can be analyzed, as shown in the figure below:
1.3.2.2 Set multiple grouping
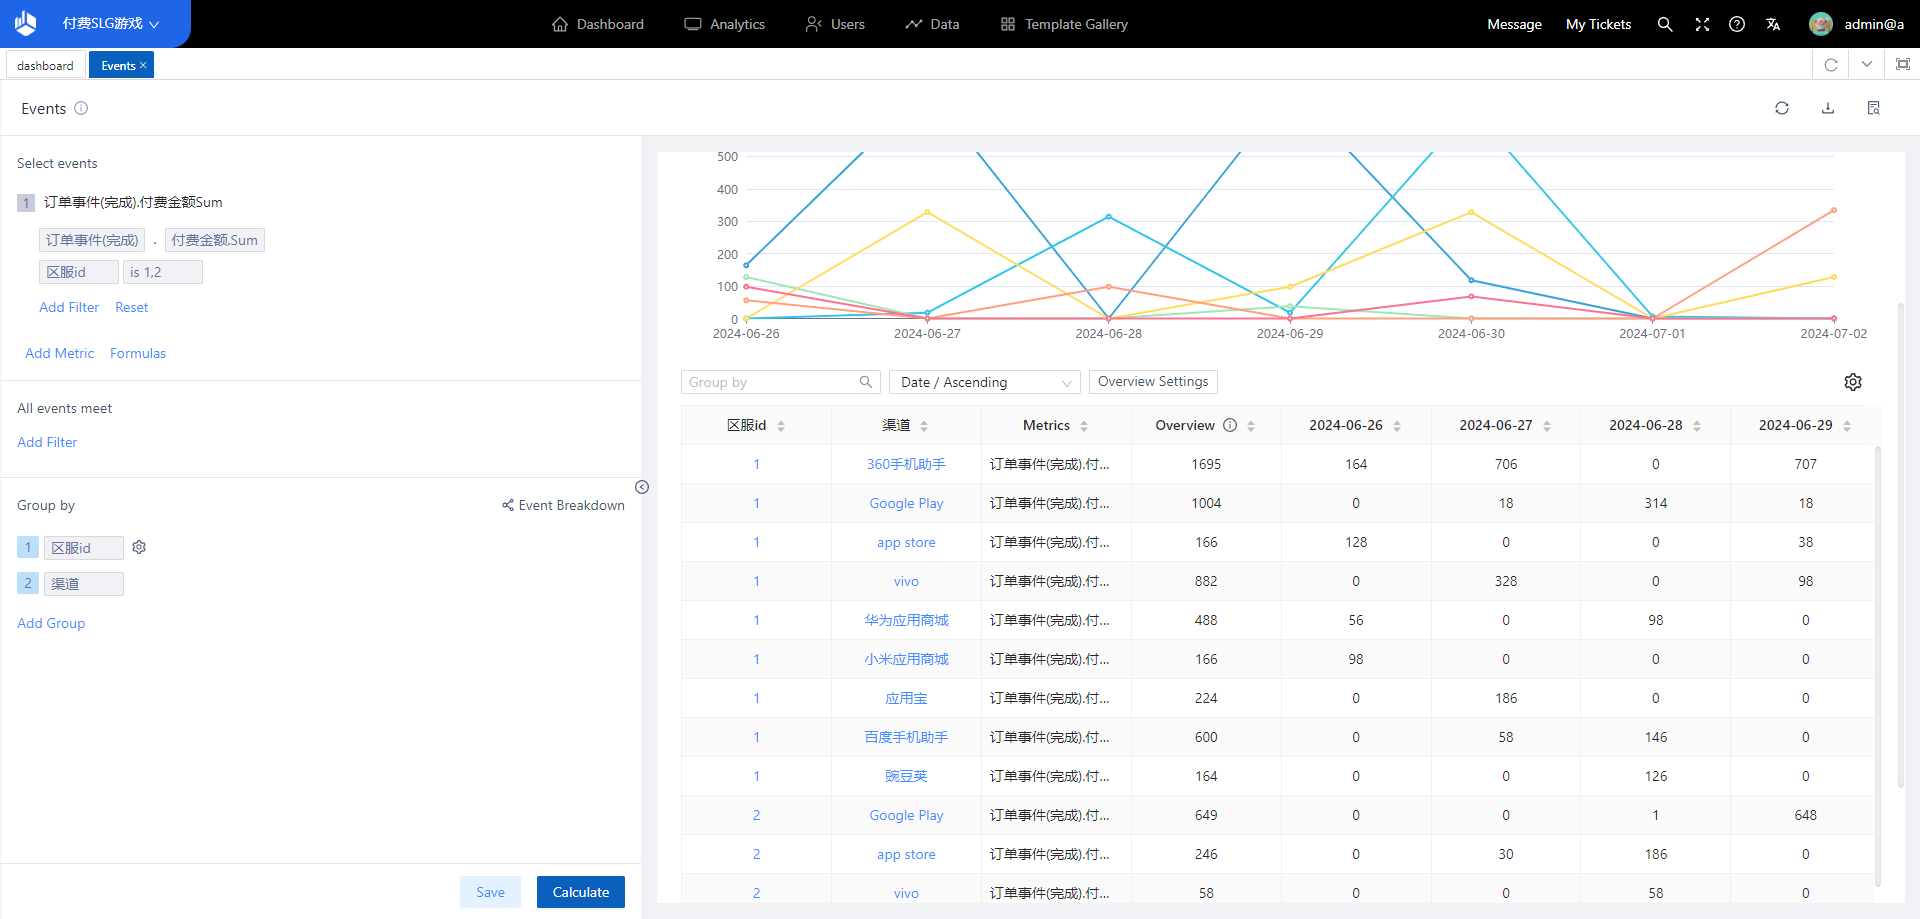
User groups can be divided into more detailed dimensions by selecting multiple grouping conditions. For example, in the above case, if the grouping item is selected as “District Service id” and “channel”, the “sum of payment amount of each paid event” of each group such as “1, Google Play”, “2, app store” can be analyzed.
1.3.2.3 Set packet mode
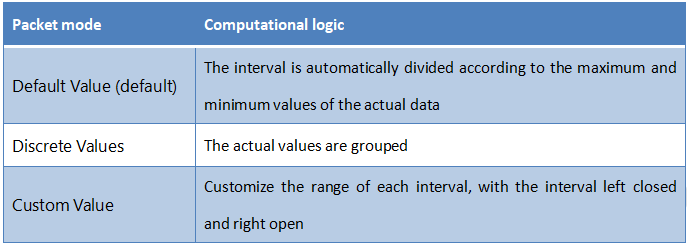
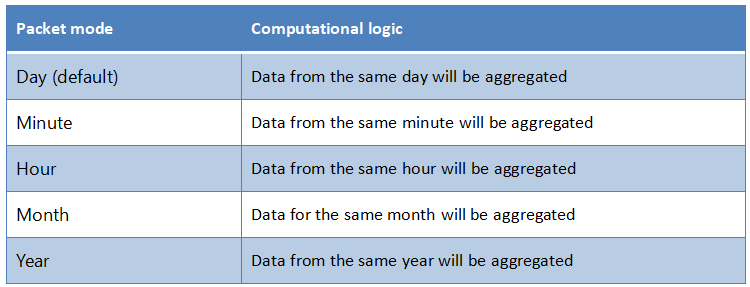
For numeric and temporal attributes, you can set the grouping mode when they are used as grouping items.
【 Numerical attribute 】
【 Time-type attribute 】
1.3.2.4 Setting Event Breakdown
Group Item is set to group all
events in an analysis object. Event
Breakdown resolves the need to collect
statistics on only one event in an
analysis object.
In event analysis,
if you add two or more analysis objects
or select Add Formula, you can set Event
Breakdown on the right of the group
item:
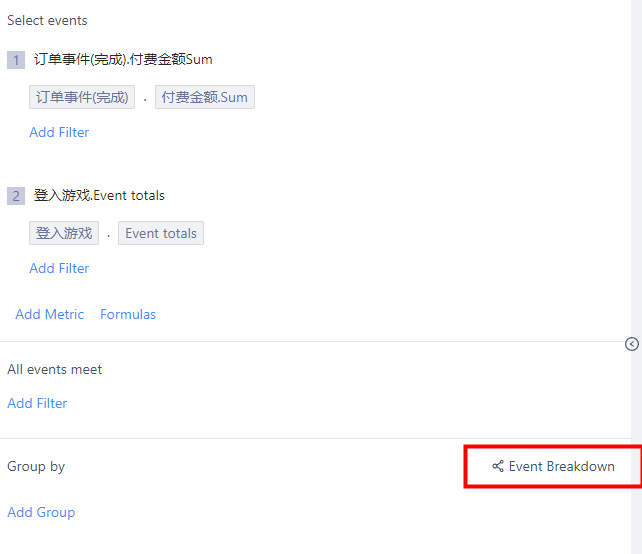
Click “Event Breakdown” to
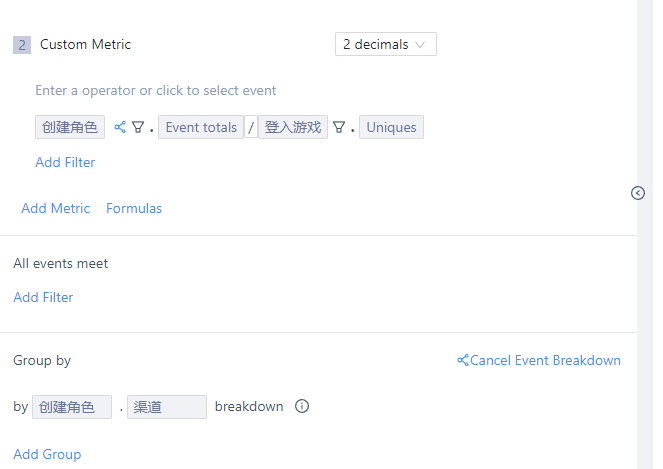
select an event (except any event) in
the
analysis indicator to be split and
calculated according to event
attributes.
As shown in the figure
below, the participating activities are
divided and calculated according to the
activity type, and the analysis index 1
is to calculate the participation rate
of different activity types.
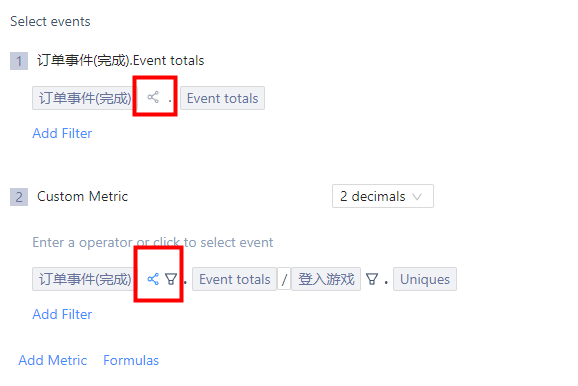
After selecting the event split,
you can click the split icon in the
analysis indicator to set the status of
the event participating in the
split.
In the figure below,
indicators in the formula participate in
the
splitting, while non-formula indicators
do not participate in the splitting,
that is, the total number of
participation paid for calculation and
the
participation rate of different
payments.
1.3.3 Selection of filtering criteria
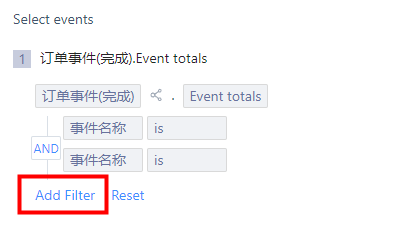
By analyzing indicators, you can
select events or users that match
certain characteristics for
analysis
This parameter is displayed
when the
filter criteria are greater than or
equal to two. The default value is
“and”.
You can click to change it to “or” to
adapt to different application
scenarios.
1.3.4 Report setup, display, download and save
When the Analysis Angle Setting area is fully selected, click Start Calculation to display the chart result in the Chart Display Area.
1.3.4.1 Shows the filter area Settings
【 Analysis particle size
】
The default analysis time
granularity
is by day. The supported time
granularity can be by day, minute, hour,
week,
month, and total
【 Analysis period
】
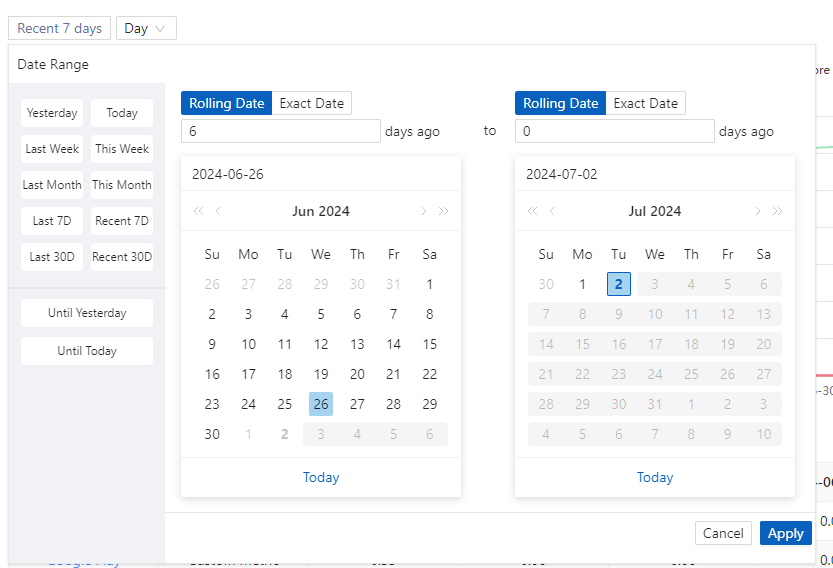
The default analysis period option
is
“last 8 days”, after clicking, the date
selector will pop up, you can select any
time
Shortcut options: The left side
provides some shortcut options for easy
selection, including: yesterday, today,
last week, this week, last month, this
month, last 7 days, last 7 days, last 30
days, last 30 days, from date to
yesterday, from date to
date
User-defined: To meet the
requirements of
user-defined time range, you can
customize the start time and end time on
the
right. Static time and dynamic time are
supported
Static time: Select a
specific date that does not change with
the current date, such as
2022-08-23
· Dynamic time: Select the
relative time range of “Current Date”,
which changes with the current date.
Note: When the end time is Static time, only static time can be used for the start time.
【 Display analysis indicators
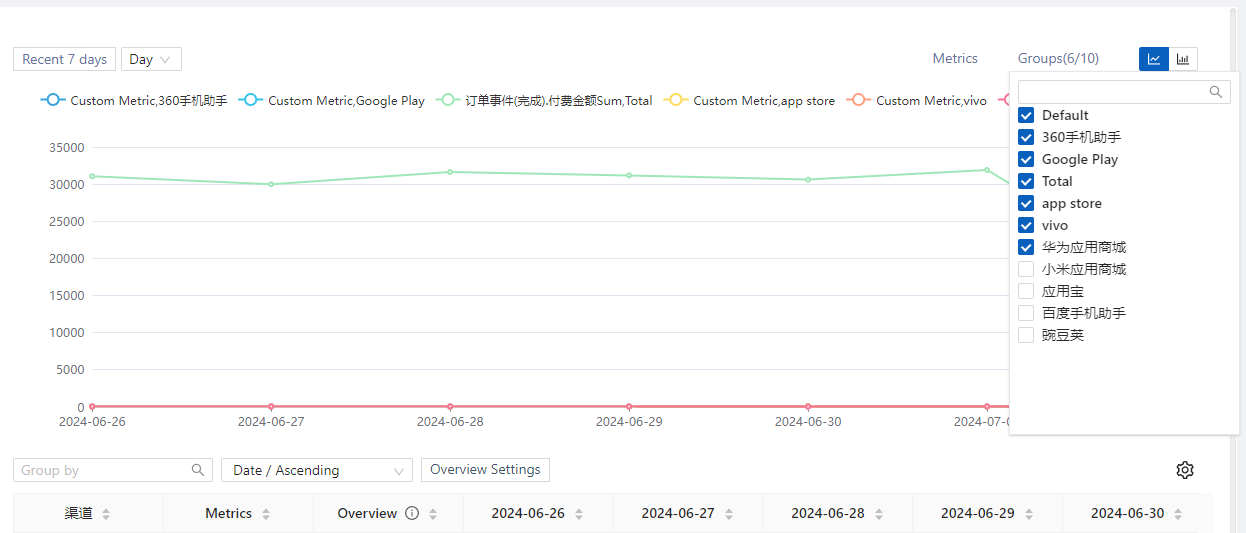
and display groups 】
Display
analysis objects: All analysis objects
are displayed by default. A maximum of
10
analysis objects are displayed. You can
modify the objects to be analyzed in the
check box.
Show groups: You can
modify the groups you want to analyze in
the
check box.
1.3.4.2 Presentation of report contents
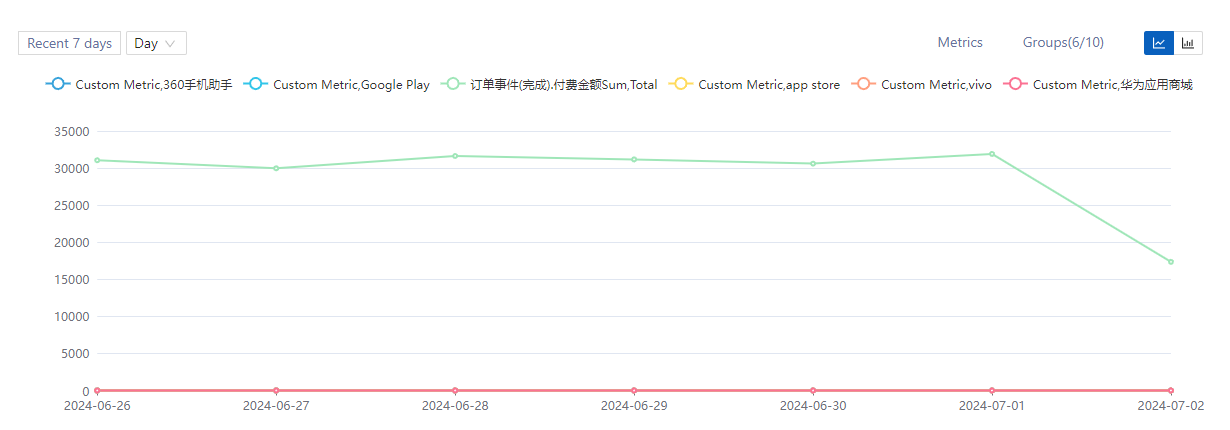
【 Chart area 】
The chart
title shows the display name information
of the analysis object.
The legend
section displays legends according to
the
total number of legends composed of
analysis objects and
groups.
Presentation
data will be determined and presented
according to analysis period and
analysis
granularity, analysis object and display
grouping, and chart style.
Display
of line trend chart:
【 Form area Display 】
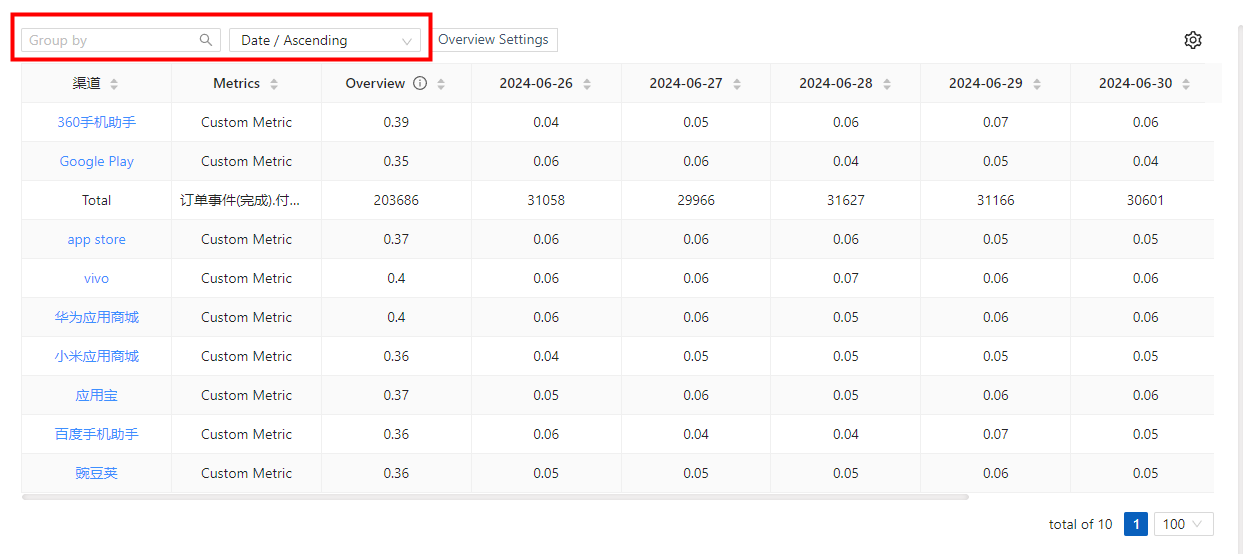
You can
filter the group items, for
example, you can search “Beijing” when
you group by province.
If you need to
swap rows and columns, you can switch By
Time, by Event, and By Group if there
are group items
1.3.4.3 Query and download event details
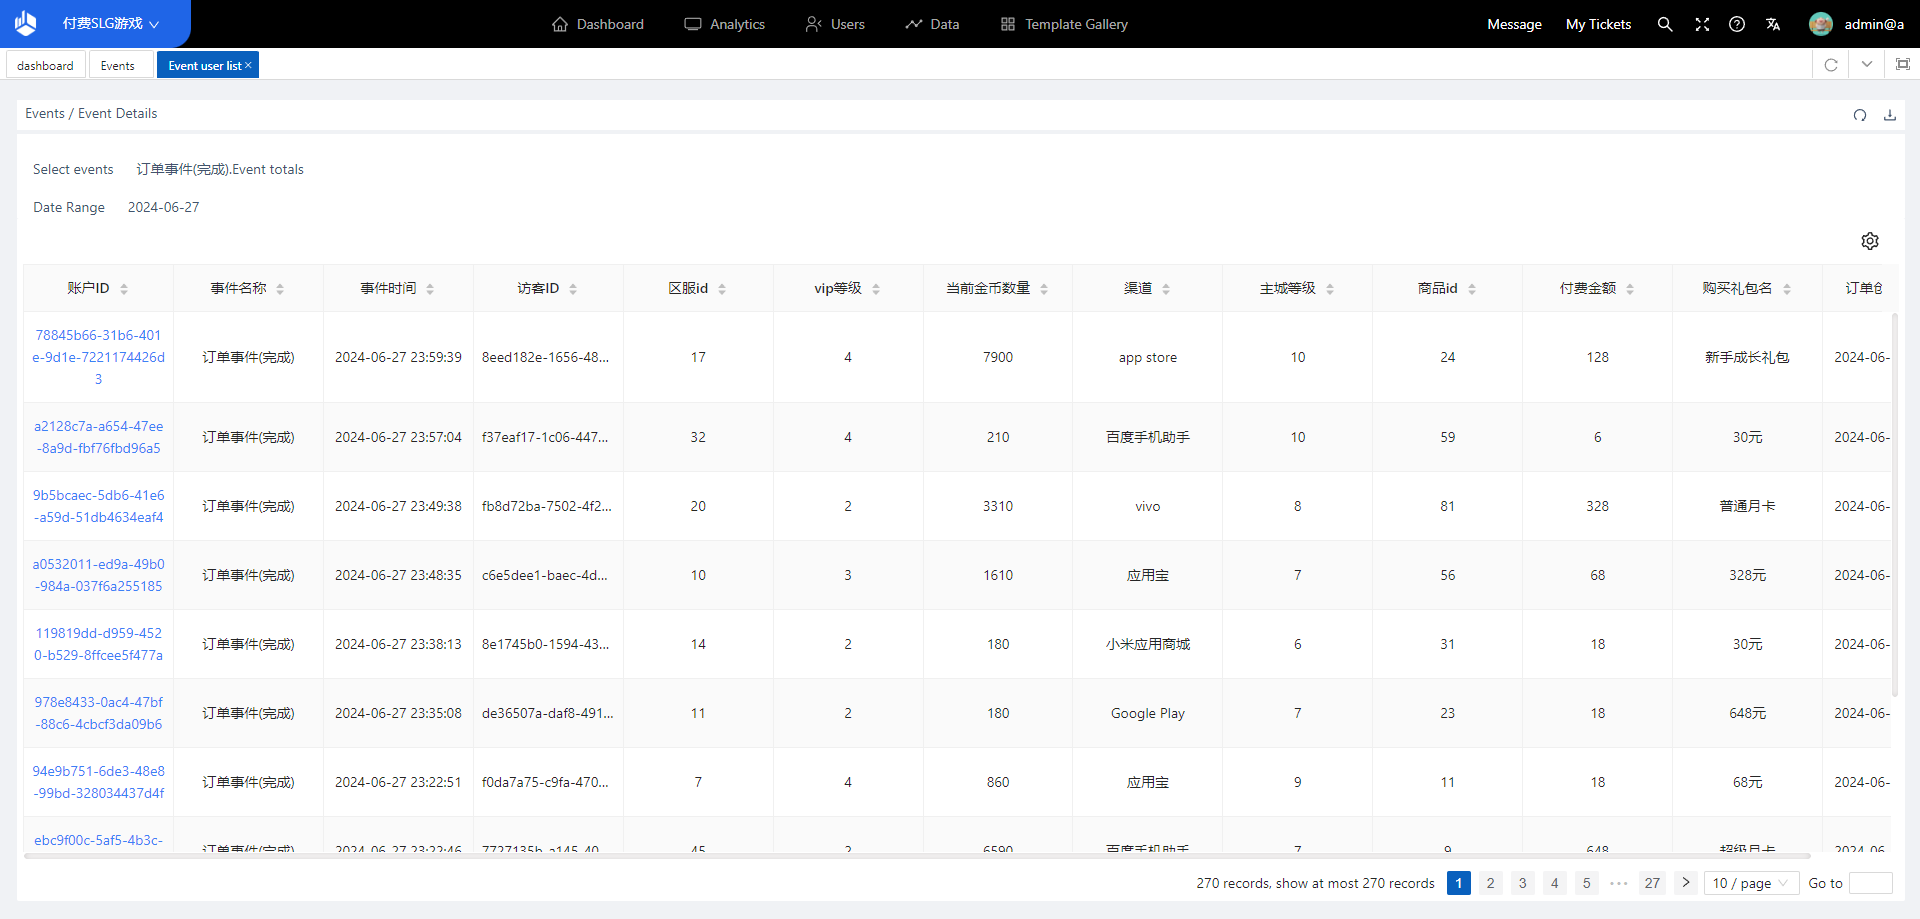
Select the total number of events analyzed, and the user can enter the event details by clicking on the link in the table

1.3.4.4 Retention of reports
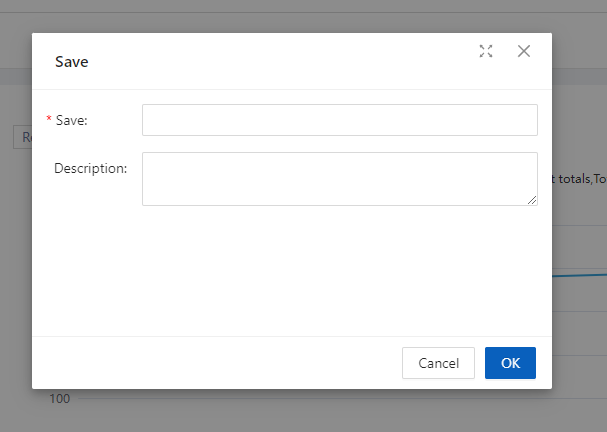
When saving, you need to enter [Report name] and [Report Remarks] to facilitate daily viewing. After saving the report, you can edit and modify the report in Report Management.
2. Retention
2.1 The significance of Retention
Retention analysis mainly
analyzes the overall participation
degree
and activity degree of users, and
examines the number and proportion of
users
who will return to a certain initial
behavior.
Through the retention
analysis
model, it is possible to analyze the
return visits of users who complete an
initial event within a period of time,
so that the impact of the event can be
macro-controlled and the decision can be
optimized.
For example, from user
activity to consumption, the following
problems can be solved:
- Within 1 month after users use the product, the number and proportion of consumption transformation?
- The number and proportion of users who complete consumption within 1 month after using the product, and the consumption amount reaches 200 yuan?
- The number and proportion of Shanghai users who have converted their consumption within 1 month after using the product?
- The number and proportion of first-tier city users who completed consumption within 1 month after using the product, and the consumption amount reached 200 yuan?
- What is the 30-day LTV status of full users
2.2 Location of Retention
Select “Retention Analytics” from “Analytics” in the top navigation bar to access the Retention Analytics model.
2.3 Page overview of Retention
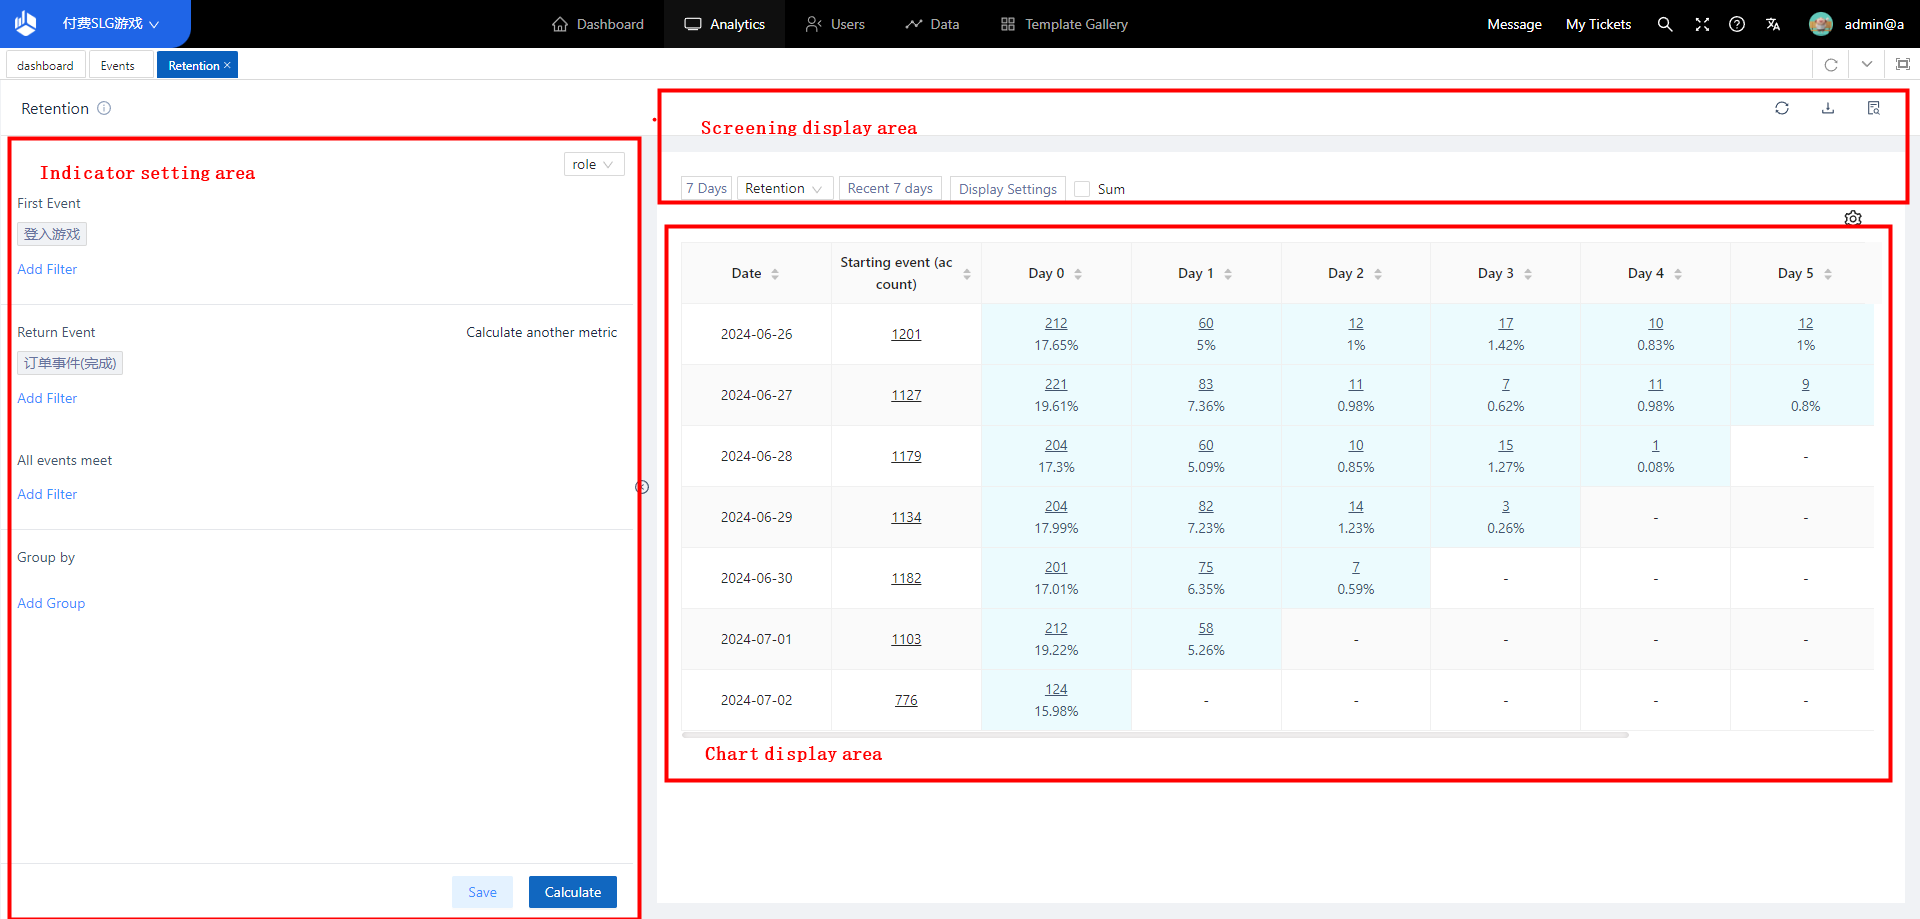
Retention analysis is divided into three parts: indicator setting area, display setting area and display chart area. You can determine the content of the analysis by setting the analysis angle. And by selecting the display filter option, the required analysis table or graph is drawn in the chart area
2.4 Usage Scenarios for Retention
2.4.1 Setting of analytical indicators
2.4.1.1 Initial event selection
Users who have had an initial event behaviour will be used as a data source for the analysis sample and will play a role in the overall analysis. The checkboxes allow you to select a “meta-event” or “any event”. This means that users who have done this event on a specific date. Users who did any event on a specific date can be interpreted as “they were active during that time”.
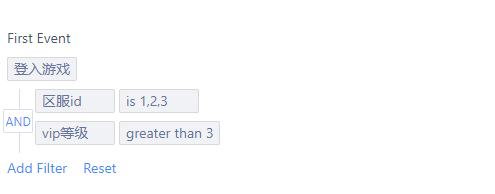
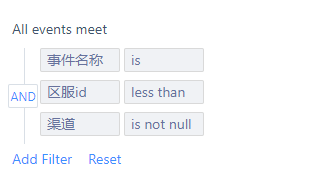
2.4.1.2 Selection of screening conditions
[Event Filtering]
Filtering
conditions are mainly designed to
accurately view the usage of specific
groups of people, such as analysing the
retention of male users in Shanghai. You
can filter both initial and return
events. Through the “filter conditions”,
you can select events or users that
meet certain characteristics and then
analyse them.
[All events meet]
2.4.1.3 Selection of return events
Returning users are users who have completed a return event after a specific period of time for the initial event user. A “meta-event” or “any event” can be selected in the checkbox. That is, the user who has done the return event on a specific date. Users who have done any event on a specific date can be interpreted as “they have been active during that time”.
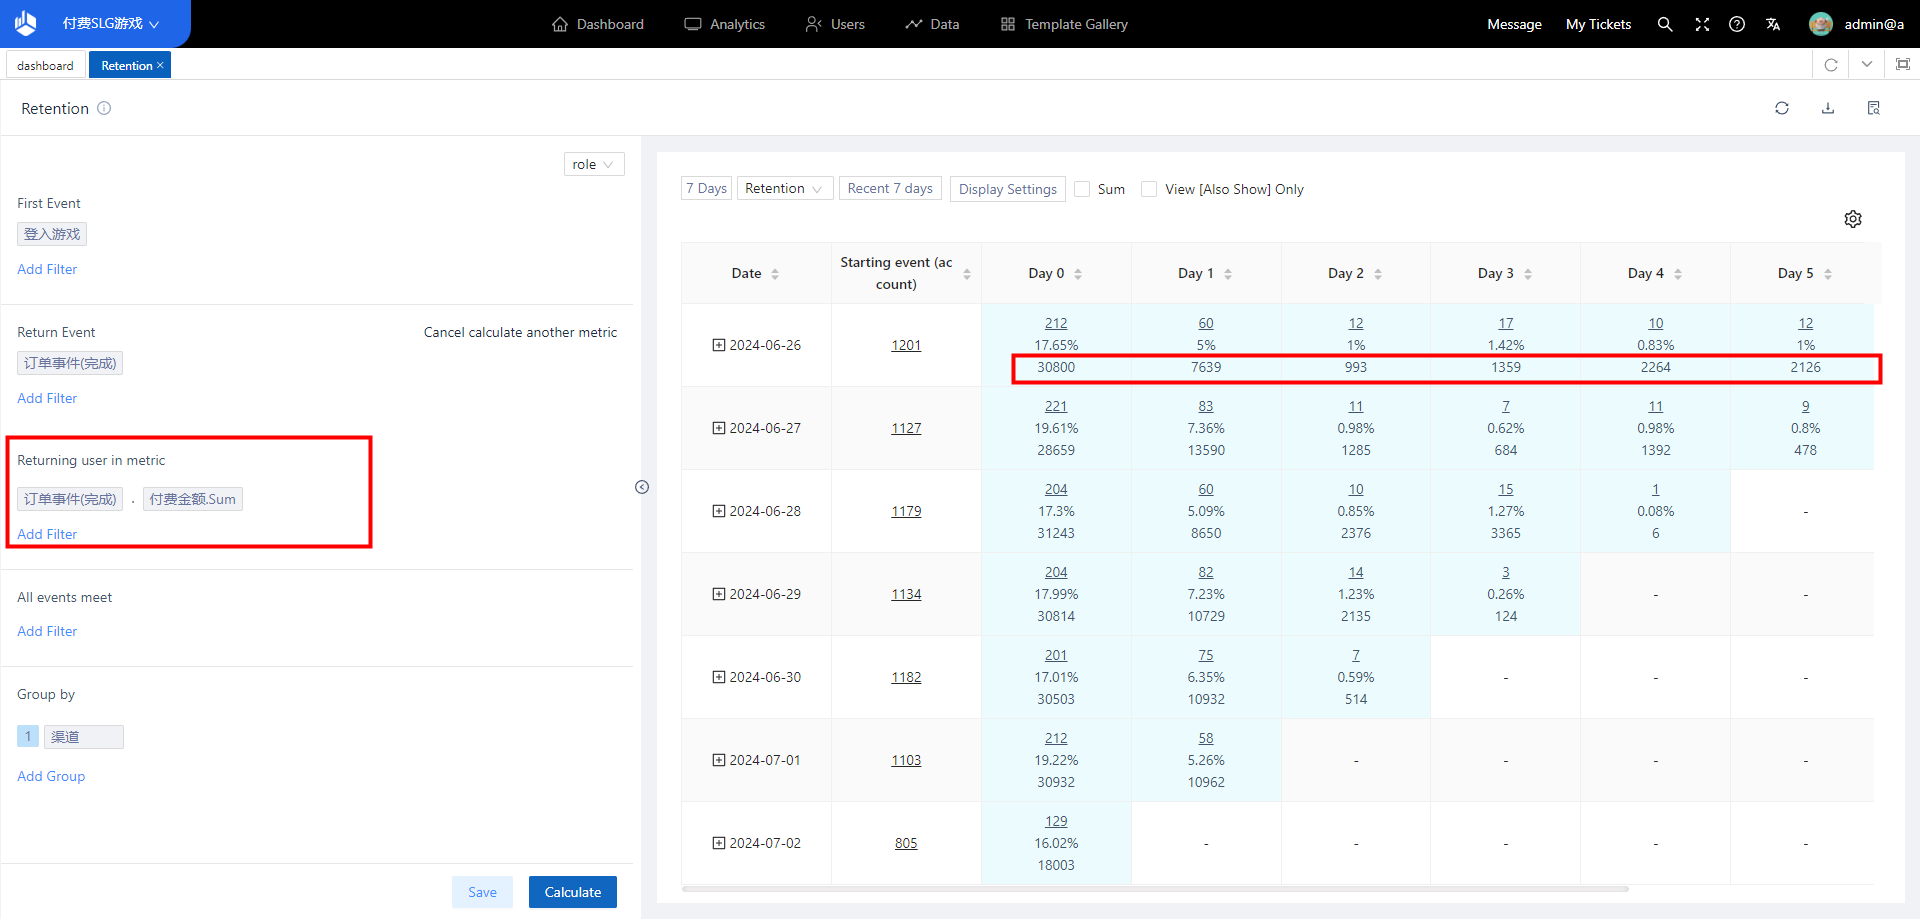
2.4.1.4 Selection of Calculate another metric
[Meaning of Calculate another
metric]
While analysing and
filtering the retained users, we may do
some more in-depth analysis on the
retained users.
For example, to
independently analyse the active, paid,
LTV
and other data of the retained users, we
can use the simultaneous display
function to deeply analyse some specific
indicators.
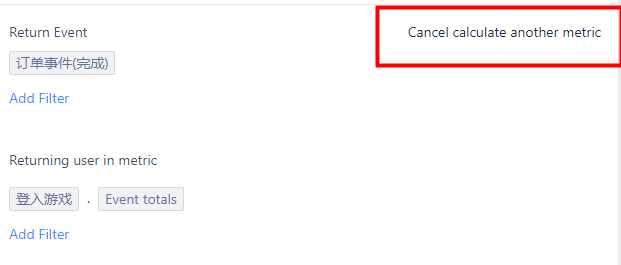
[Entry for Calculate another
metric]
When clicking on “Calculate
another metric”, the content to be
analysed will appear, and you can select
the
required events and analysis angle
through the drop-down box.
[Analytical perspectives for
Calculate another metric]
Similar to
event analysis, Calculate another metric
of metrics can be “Event” + “Attribute”
+ “Calculation Method” or directly
“Event” + “Calculation Method”.
2.4.1.5 Group by
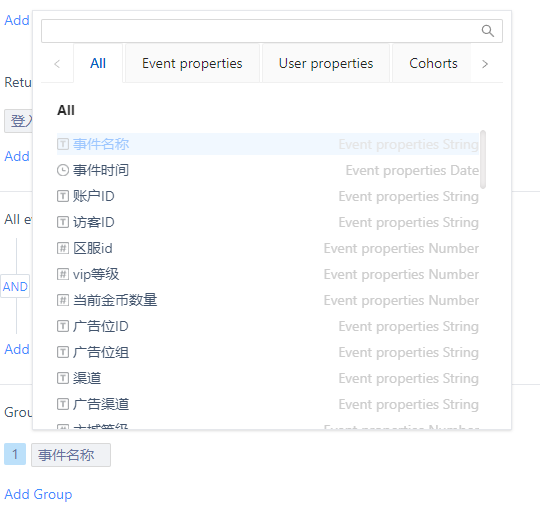
[Setting of Group by]
Event
attributes and user attributes can be
selected as grouping items.
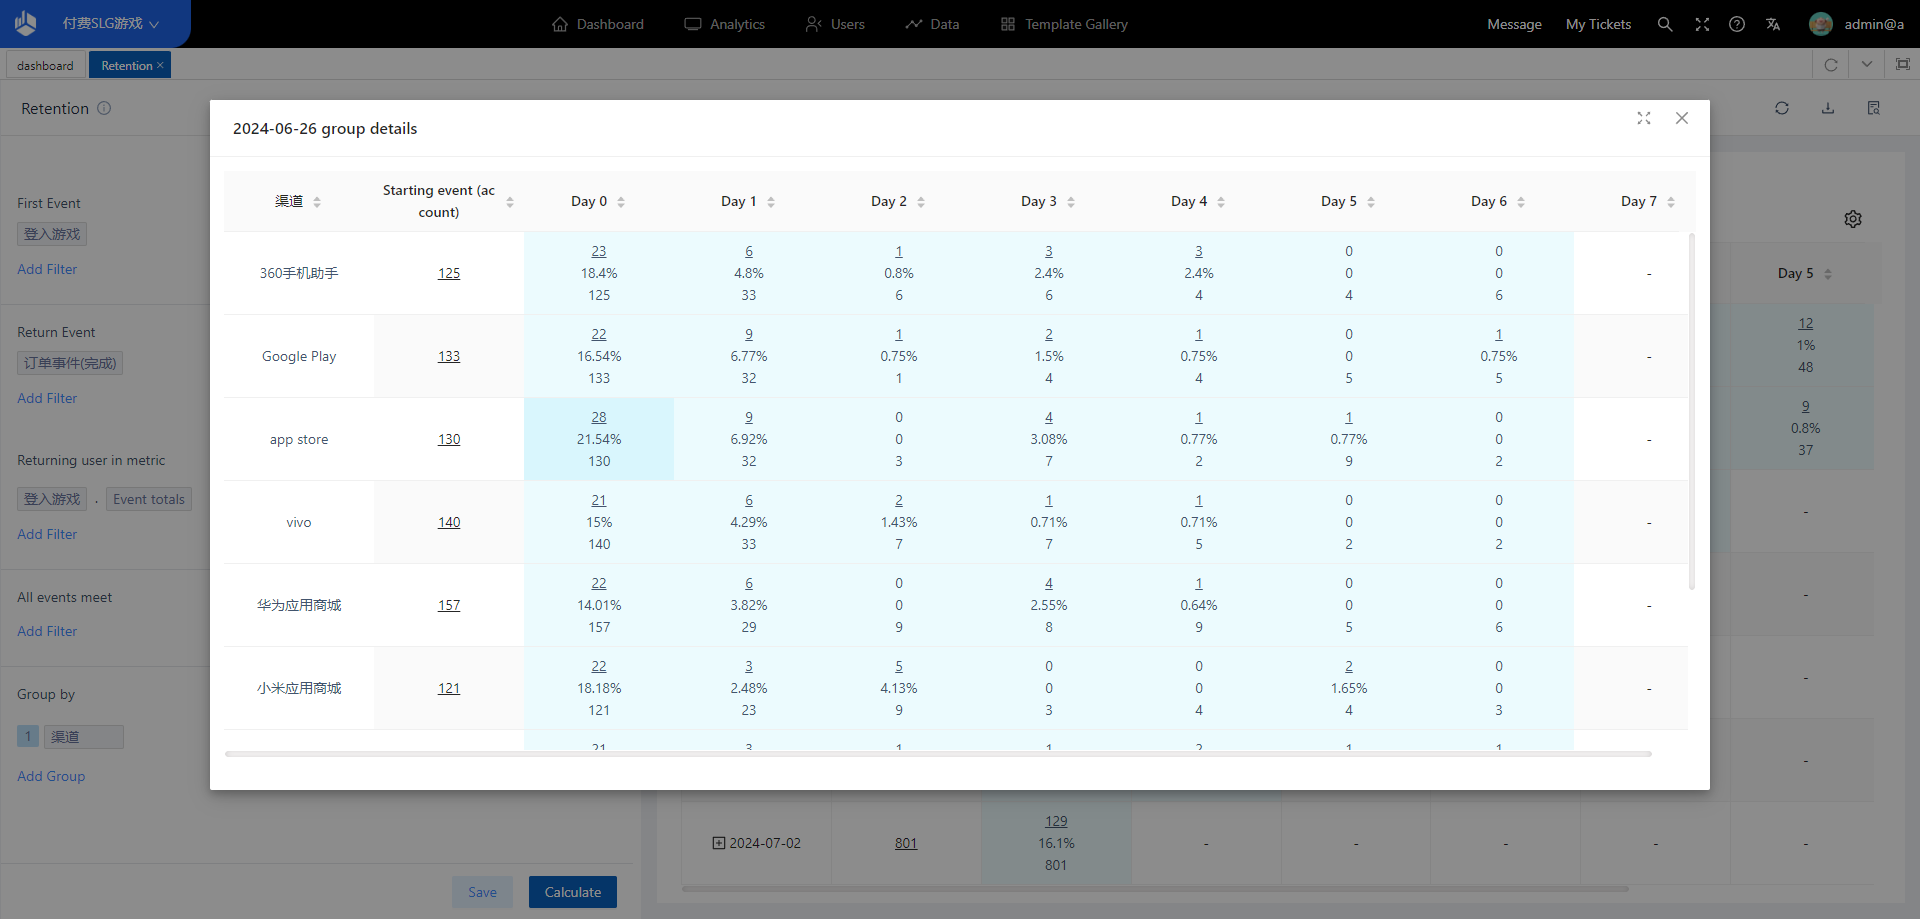
[Grouping Presentation]
Under
the data table style, click the “+”
button to view the group details in the
pop-up window.
2.4.2 Setting of Display Setup Area
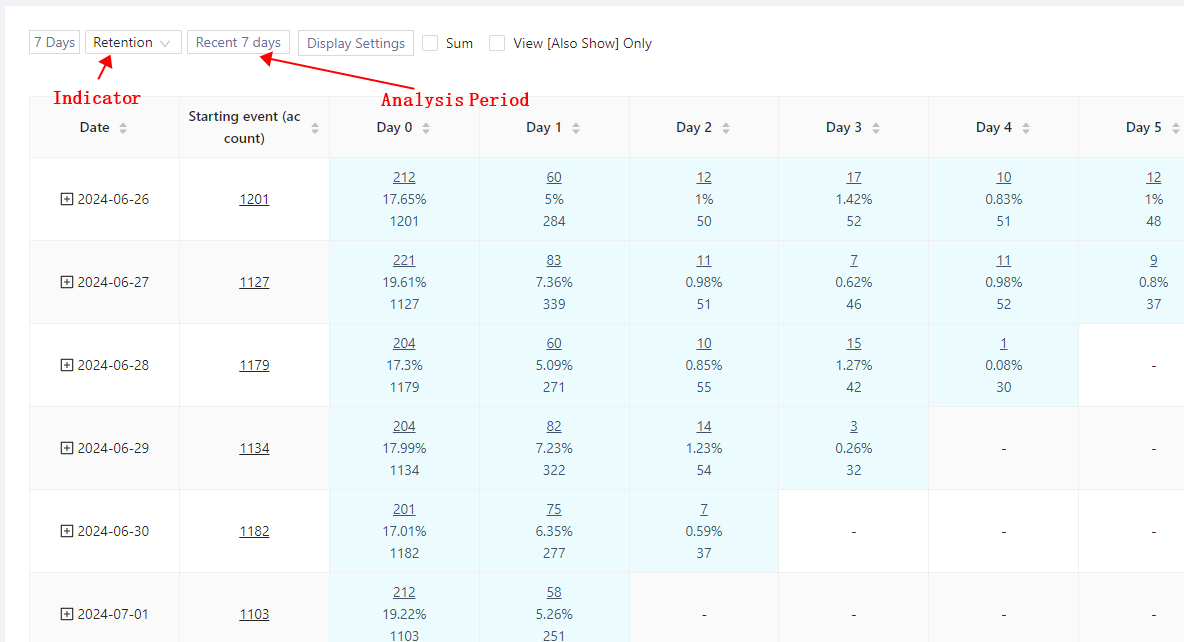
2.4.2.1 Period of analysis, duration of analysis and indicators
- You can restrict the data to be analysed for a specific period of time through the “Analysis Period”.
- You can switch the performance of retention and churn under different volumes through “Analysis Period”.
- You can select the angle of analysis through “Indicator”, such as “Retention, Churn”.
2.4.3 Chart presentation and data download
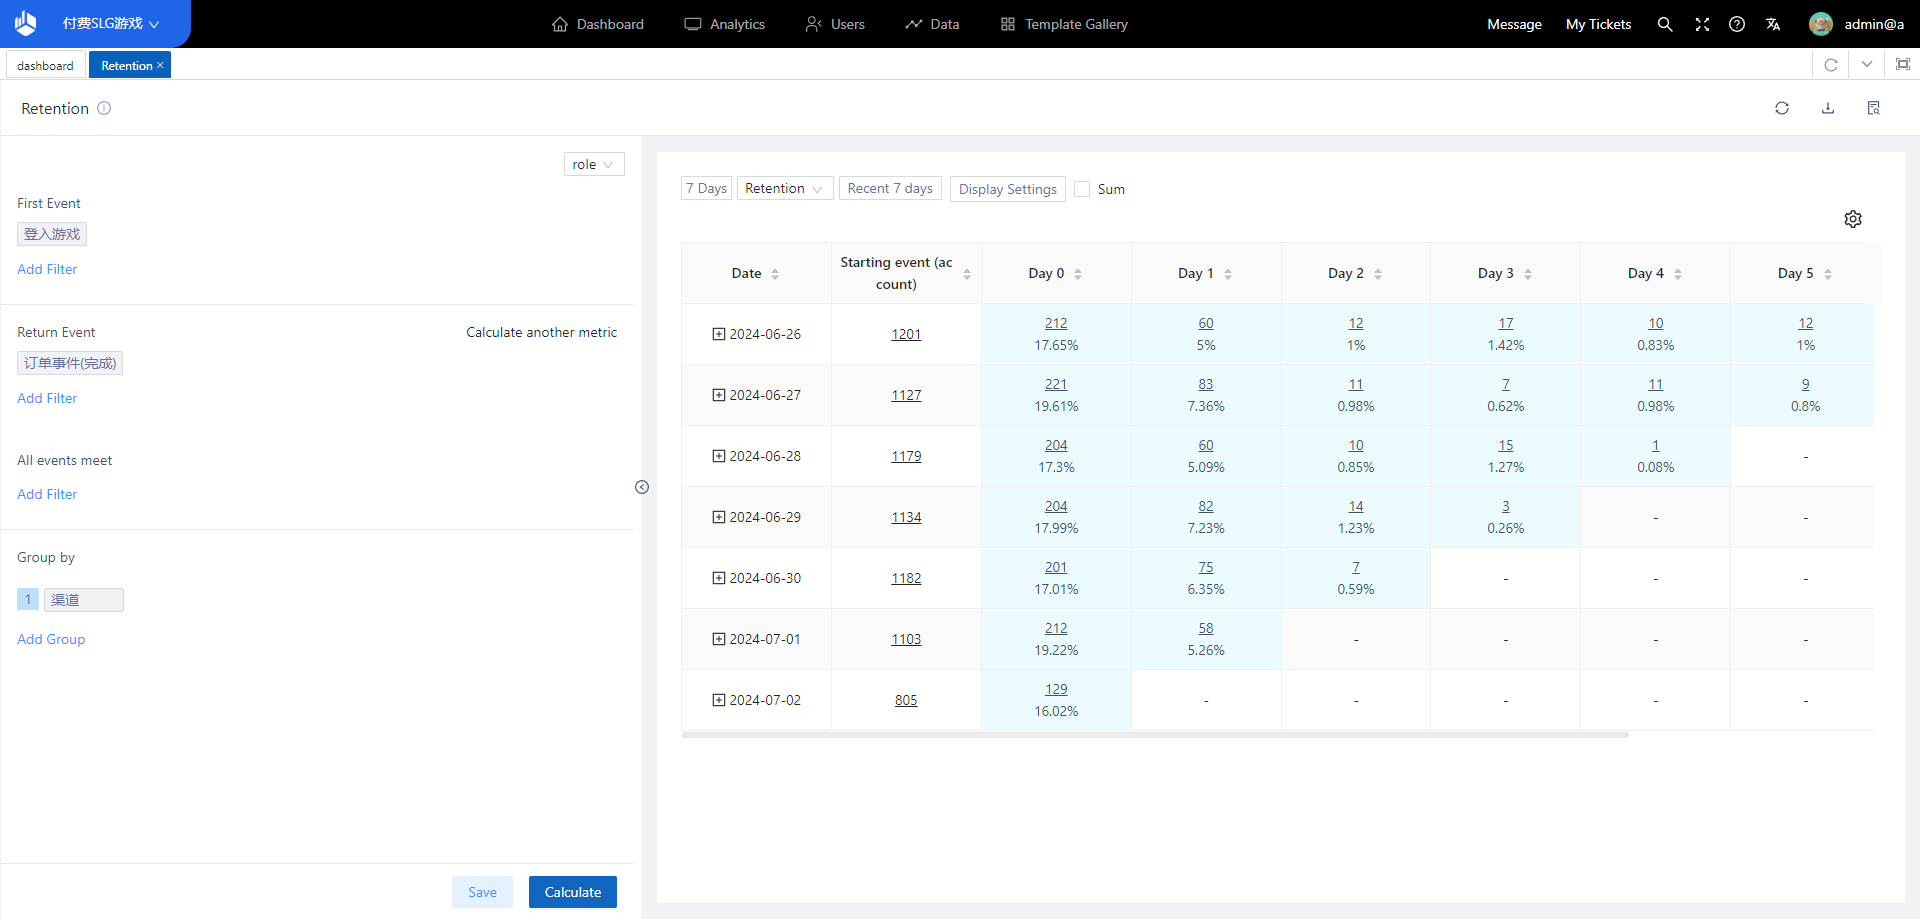
2.4.3.1 No increase in simultaneous display of display content
2.4.3.2 Increase the number of displays that can be shown simultaneously
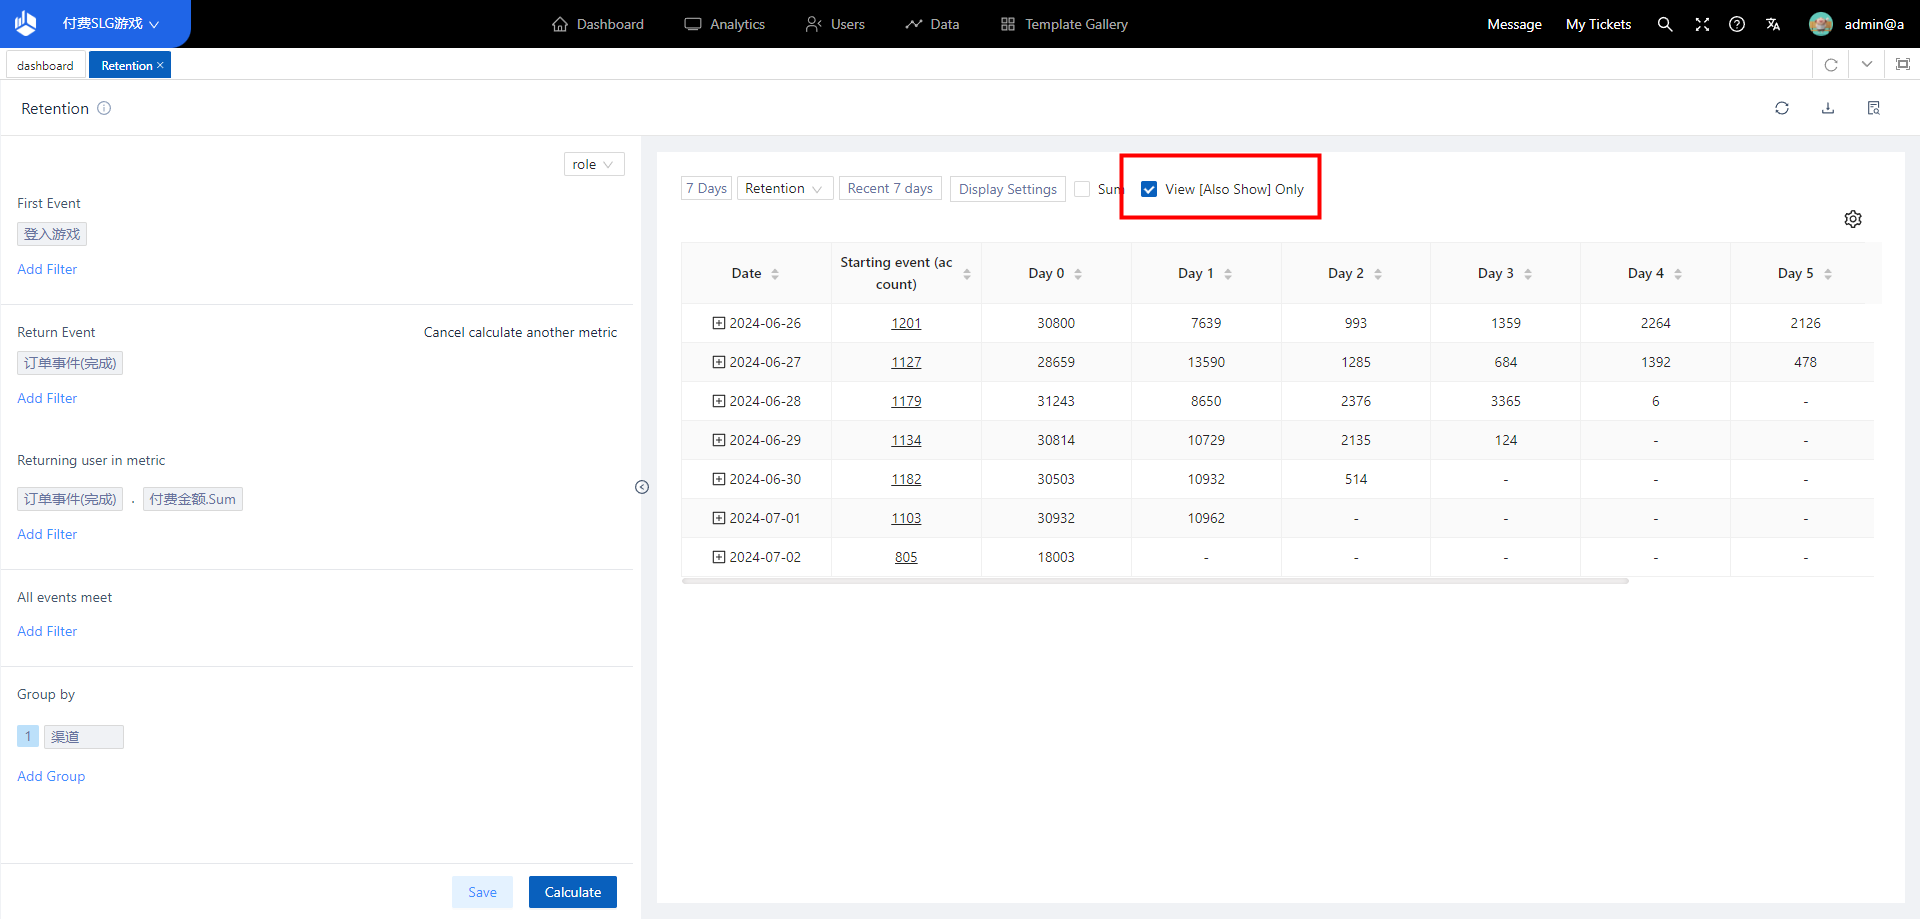
2.4.3.3 Only display content that is displayed at the same time
2.4.3.4 Text alert
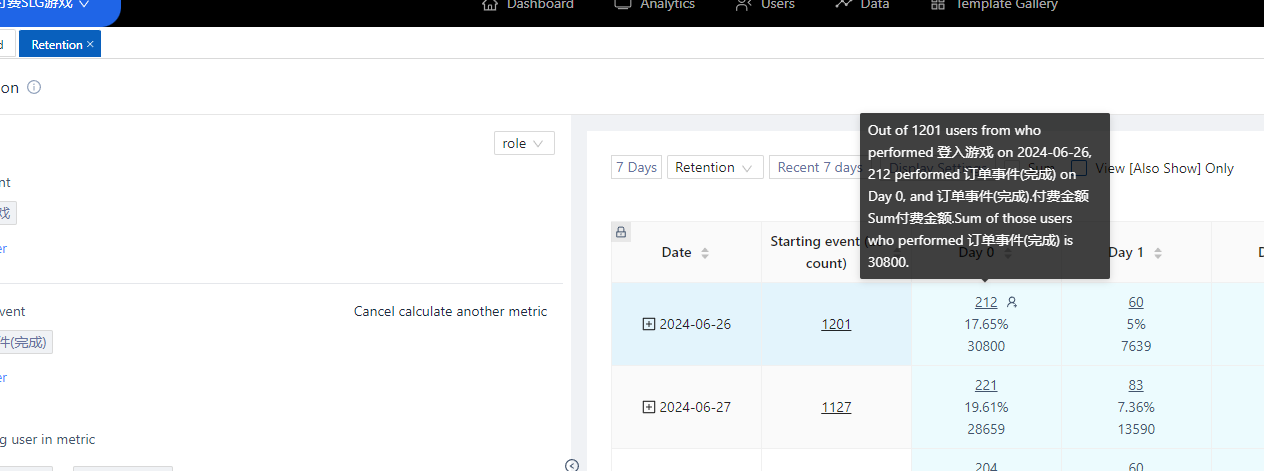
Mouse over the chart box and a text prompt will be displayed.
2.4.3.5 Data Download
The style of the downloaded table is the same as when the chart is styled as a table, in csv format.
3. Funnel
3.1 The significance of Funnel
Funnel analysis is a kind of
analysis model to analyse the
conversion of users in the specified
steps of the behavioural flow, which can
help analysts quickly grasp the
conversion of the product in each step
of the
process over a period of time, so as to
achieve the purpose of checking the gaps
and filling the gaps, and optimize the
conversion process.
The following
business scenarios can be solved through
funnel analysis:
- Analyse the conversion of users who log in and participate in daily activities.
- Analyse the conversion of users who register, log in, complete the novice guide, participate in activities, consume props, and pay.
- Analysing the difference in the conversion of payment by platforms
3.2 Location of Funnel
Select “Funnel” from “Analytics” in the top navigation bar to access the Funnel Analytics model.
3.3 Overview of the Funnel Analysis page
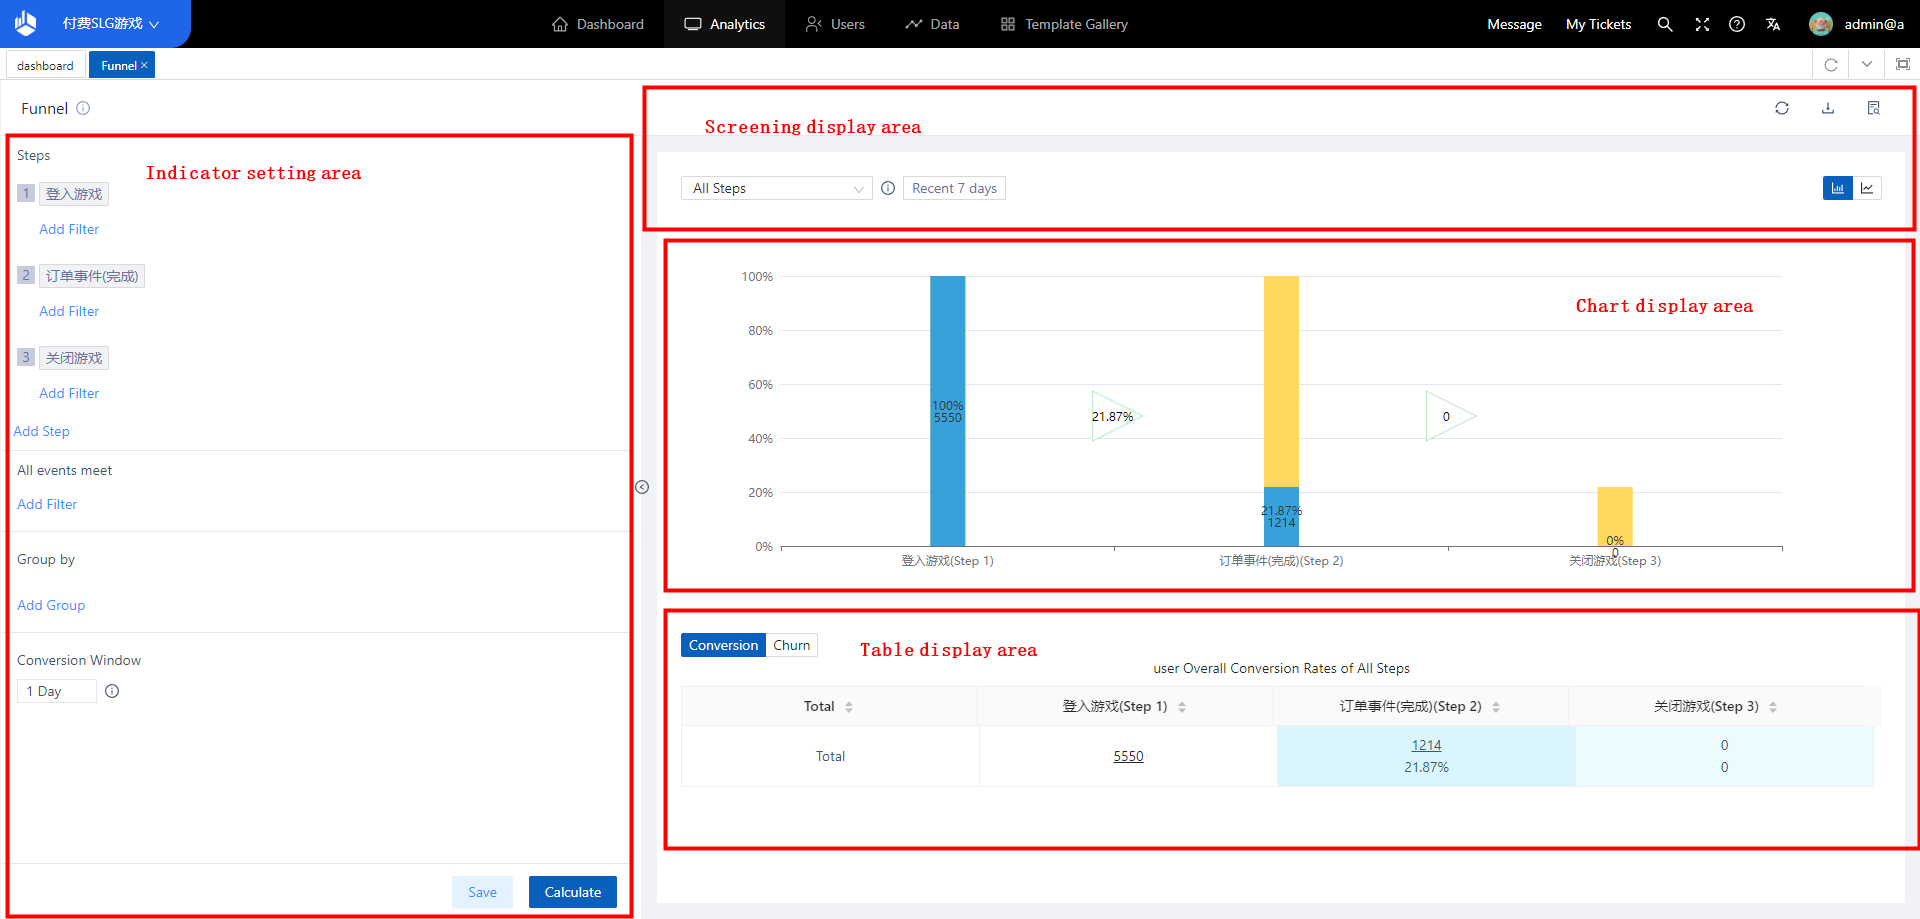
Funnel analysis model consists of “indicator setting area, display filter area, display chart area, table details area”.
- In the “Indicator Settings Area”, set the “Analysis Steps, Grouping Methods, Analysis Window Period”.
- In the “Display Filter Area”, set “Analysis Time Period, Analysis Steps, Group Settings”.
- In the “Show Chart Area”, you can mouse over a grouped object to view the details and see the corresponding “single-step conversion rate” of each step, and set the “chart style”.
- In the “table details area”, you can view all the funnel data information of the subgroups.
3.4 Scenarios for the use of Funnel
3.4.1 Setting of the indicator setting area
3.4.1.1 Setting of the indicator setting area
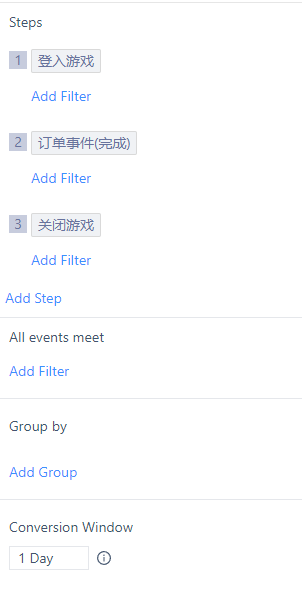
(1) “Funnel Steps” are two
steps, respectively, two events in
metadata management, you can switch to
select an event (you can not select any
event) or add steps.
(2) “Global
Filter” can filter the event attributes
or
user attributes common to all
steps.
(3) “Grouping items” is empty
by
default, i.e., no grouping, you can
select one of the event attributes, user
attributes, user subgroups and user
labels in step 1 to add.
(4)
“Analysis
Window Period” is 1 day by default, you
can select the same day in the drop-down
box or a custom window period by day, by
hour, by minute.
3.4.1.2 Adding, deleting and filtering conditions in the analysis step
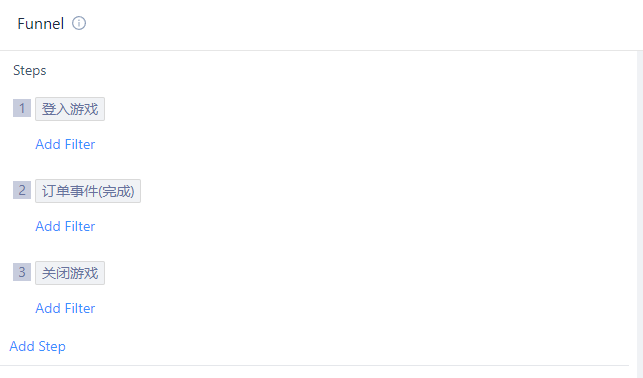
- You can insert a new step by clicking the “Add Step Indicator” button or by clicking the “+” button of a step, and you can add up to 30 steps.
- You can delete a step by clicking on the “Delete button” of the step, and the serial number of the other steps will be changed after the step is deleted. In addition, the “Delete Button” is not displayed when there are only 2 steps.
- You can add filter conditions by clicking on “Add Condition” of a step, the logic of adding, deleting and changing filter conditions is the same as that in event analysis.
3.4.1.3 Definition of the analysis window period
The analysis window period, i.e., the total analysis timeframe counting from the start of the triggering step 1 using the user who triggered step 1 as a sample, is fixed in length for each user, but the start and end funnel absolute dates may be different due to the point in time at which step 1 was triggered.
3.4.2 Setting of Screening display area
3.4.2.1 Default Initial Page
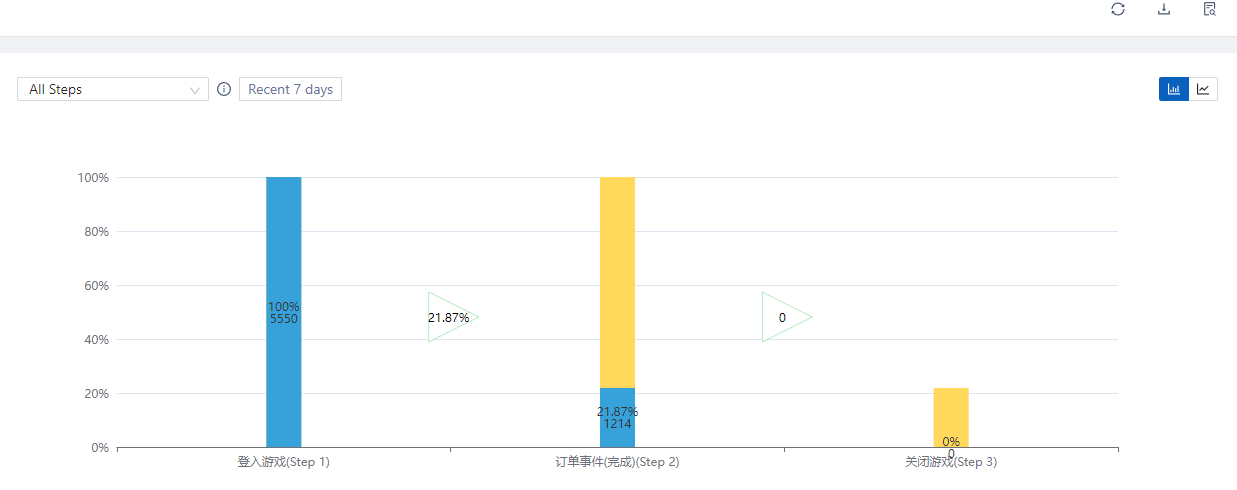
3.4.2.2 Definition of the analysis period
The analysis period determines the selection interval for “Trigger time for step 1”, the drop-down box is the same as for event analysis.
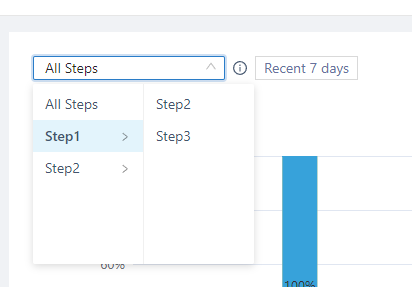
3.4.2.3 Operation of step checkboxes
The Steps checkbox selects all steps by default, or you can select steps from M to N in steps.
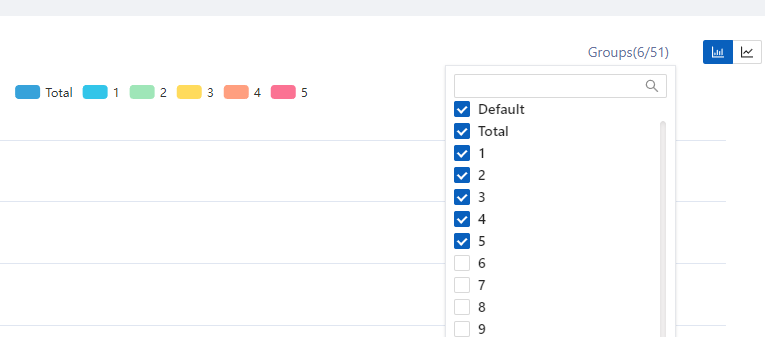
3.4.2.4 Grouping Setup
Chart settings differ from event
analysis in that the overall always
appears as the first item in the
grouping
When more values are set for
grouping, 6 groups are selected by
default
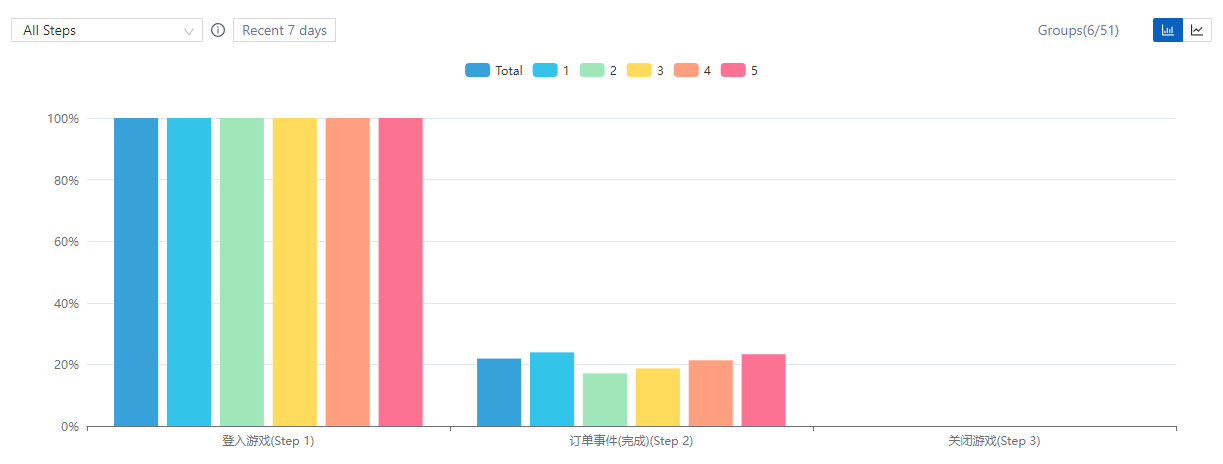
3.4.3 Setting of Chart display area
3.4.3.1 Cumulative conversion funnel content
(1) Using the first of the
selected steps as 100%, calculate the
number of conversions after each step
and give the ratio
(2) In the display
of each step, the conversion rate of the
previous step is indicated by the
background fill colour.
(3) When the
mouse moves into a grouped object, the
grouped object is highlighted, showing
the corresponding conversion rate, the
number of people converted and the
conversion rate of a single step in the
middle of each step (the colour is the
same as that of the group into which it
is moved).
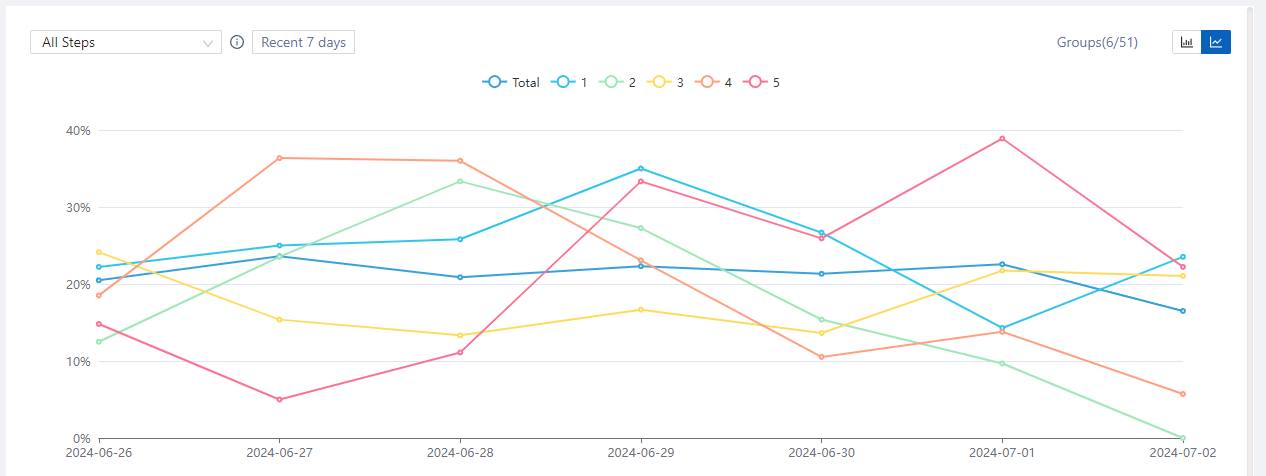
3.4.3.2 Elements of a conversion trend chart
Calculate the daily conversion rate from the beginning of the selected step until the last selected step, using the first step of the selected step as 100%.
3.4.4 Setting of Table display area
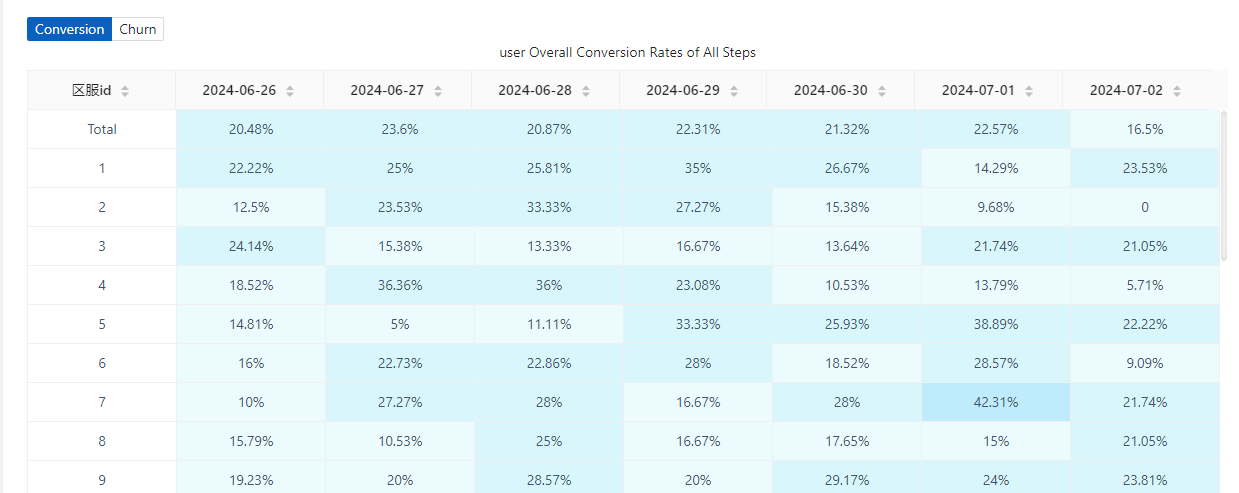
3.4.4.1 Tabular content of conversion charts
Show all subgroups (both overall and all possible groups, up to 1000 items), showing the cumulative conversions to each step and colour-coded (similar to retention tables)
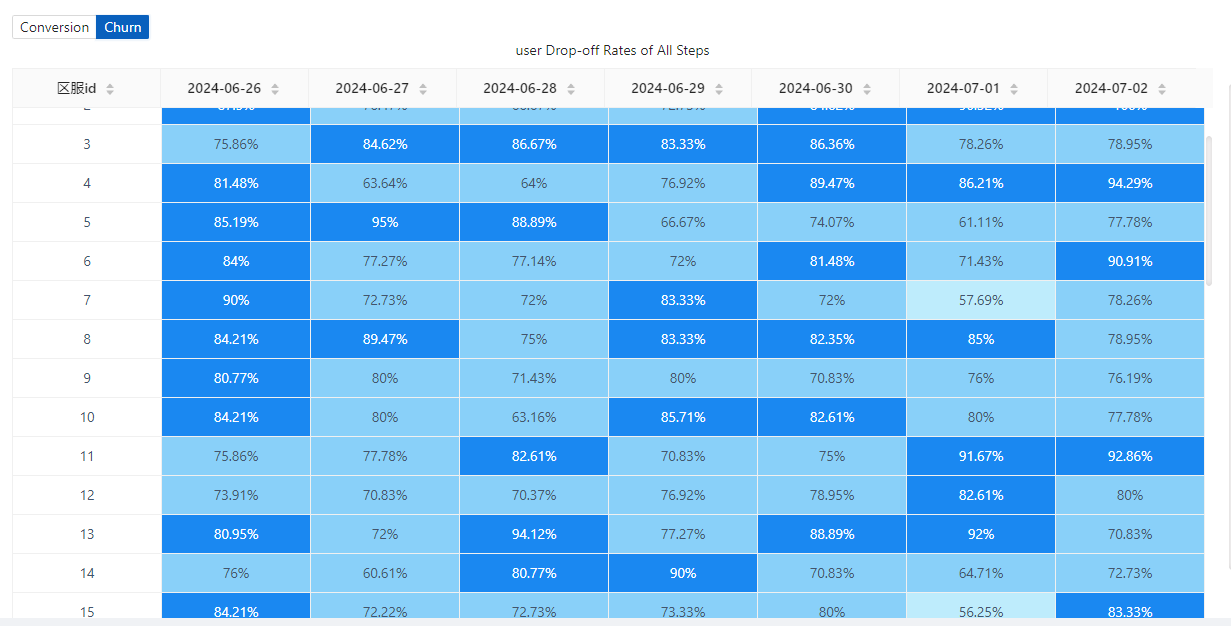
3.4.4.2 Tabular content of trend charts
4. Distribution
4.1 The significance of Distribution
The distribution analytics model
allows you to divide intervals
based on the total number of
completions, days, or attribute values
aggregated
for each user (the subject of the
analytics) and view the number and
percentage
of users in different intervals. The
following are common analysis
scenarios
Event frequency (number of
times): divide the interval by the
number of times a user participates in
battles per day, and view the number of
users with different number of battles
per day
User stickiness (days): by
the
number of days users logged in over the
past seven days, differentiate between
users with different stickiness for
subsequent analysis
Attribute Value:
Split users into large, medium and small
Rs according to the cumulative payment
amount of recharges over a period of
time, and view the proportion of users
of
different levels.
4.2 Location of Distribution
Select “Distributional Analytics” from “Behavioural Analytics” in the top navigation bar to access the Distributional Analytics model.
4.3 Overview of the Distribution Analysis page
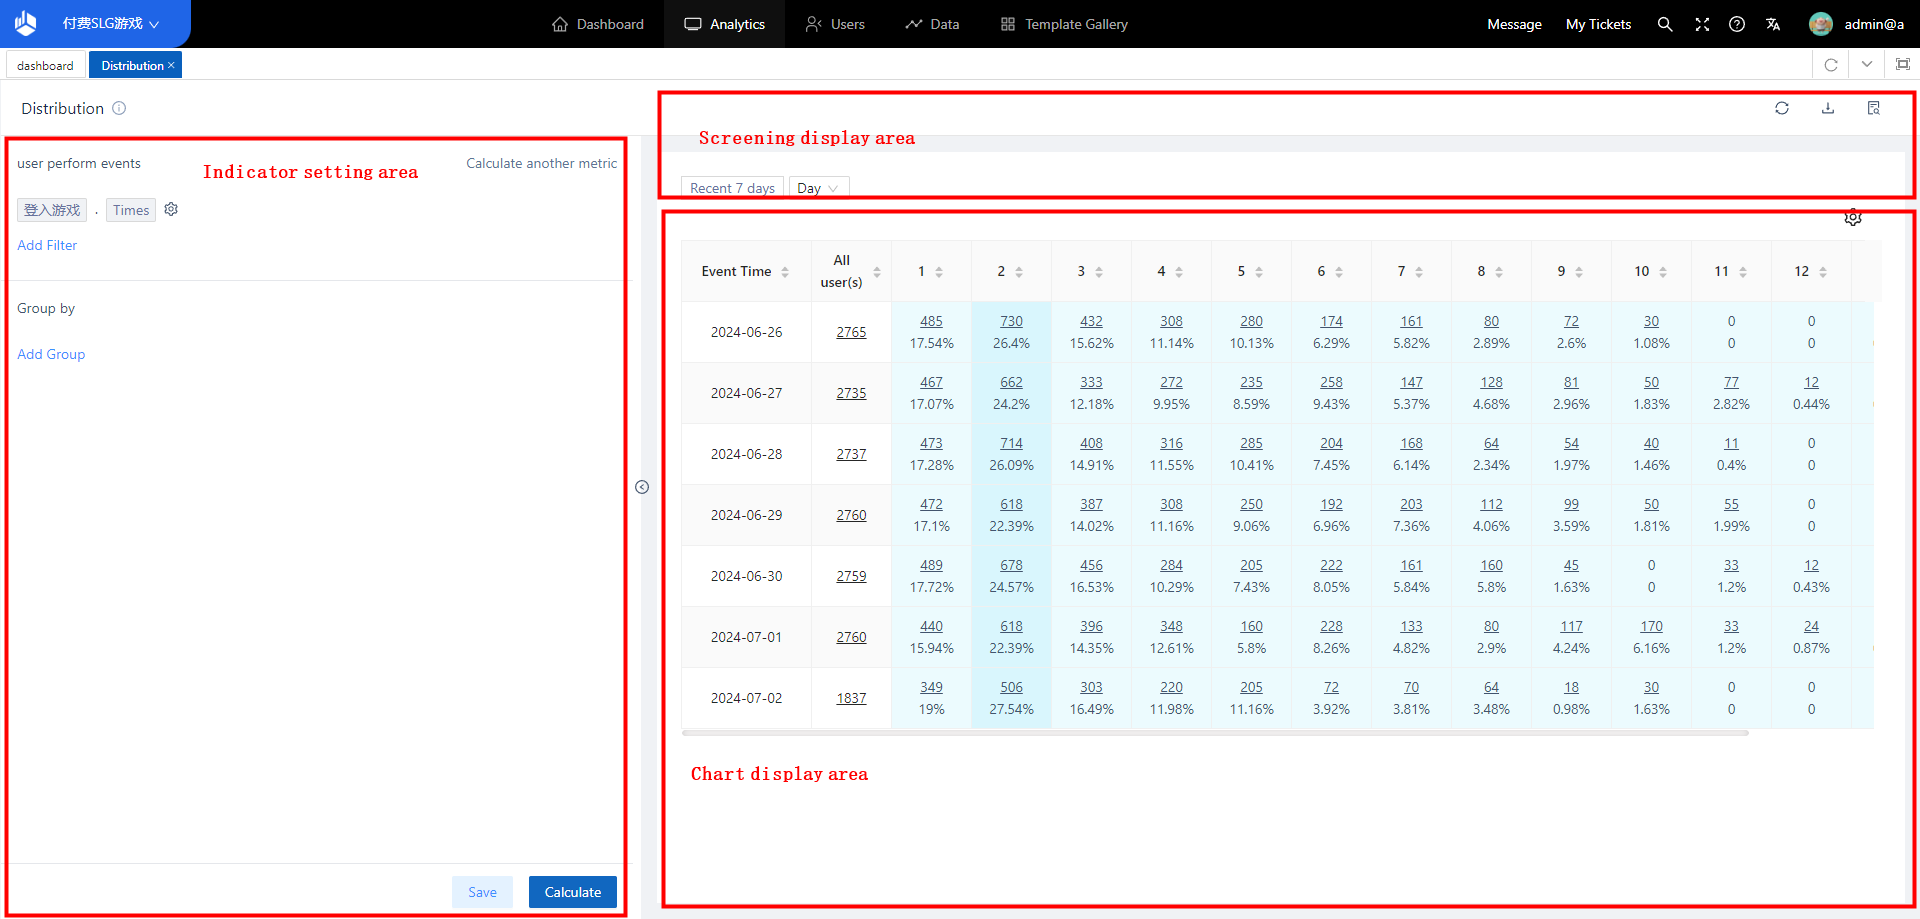
Like other models, the distribution analysis consists of three parts: “Indicator Setting Area”, “Filter Display Area” and “Chart Display Area”.
4.3.1 Indicator setting area
4.3.1.1 Setting up of user participation events
Similar to Event Analysis, Distribution Analysis can choose (“Event” + “Attribute” + “Calculation Method”) or directly (“Event” + “Calculation Method”) when setting up user participation in an event, but there is a difference between the supported calculation methods and Event Analysis.
4.3.1.2 Setting of distribution intervals
Clicking on the cogwheel icon opens the interval settings, by default the “Default Interval” is selected, and the logic of all the options is exactly the same as the interval settings of the numeric type attribute in the grouping item.

4.3.1.3 Setting of filter conditions
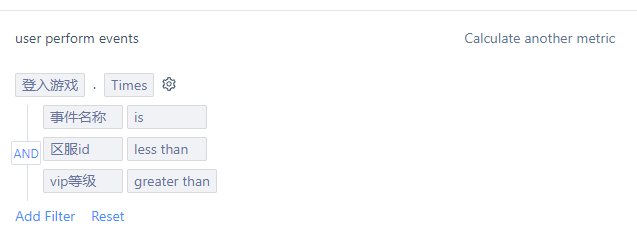
[Setting of filtering
conditions]
You can filter the event
attributes or user attributes or user
subgroups under the event, and the
filter
conditions support and or logic,
consistent with the event analysis.
4.3.1.4 Selection of Calculate another metric
Users based on a certain
distribution interval can continue to be
analysed in depth by using the Show
Simultaneously option.
Clicking on
the
“Show Simultaneously” button, a new
option will appear, named “Show User
Engagement by Zone Simultaneously”,
which can be selected as (“Event” +
“Attribute” + “Calculation Method”) or
directly (“Event” + “Calculation
Method”), and the options are the same
as those in the event analysis model.
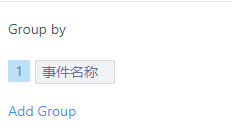
4.3.1.5 Group by
Grouping items can be selected from event attributes or user attributes of the event
4.3.2 Screening display area
4.3.2.1 Initial Analysis Page and Options
There is a choice of analysis periods, analysis granularity, grouping checkboxes, and the ability to export tables or download the full amount of data. If the Simultaneous Display option is set in the Indicator Settings area, the option “Only see simultaneous data” is displayed in the Filter Display area.
4.3.2.2 Default settings and selection range for each option
Analysis
Period: The time range
interval for
analysing the data will be determined,
with “Last 8 days (dynamic time)”
selected by default.
Analysed
Particle size: Default
is “By
day”; you can choose “By day”, “By
week”, “By month”, or “Total”. When
“Weekly”
or “Monthly” is selected, the analysis
period will be supplemented according to
the actual granularity, and the
supplementation method is the same as
that of
the event analysis
model.
View [Also Show]
Only: Unchecked
by default, when checked, all charts in
the chart display area will only be
plotted according to the indicators
displayed at the same time.
4.3.3 Chart display area
The “calculate another metric”
indicator is not set in the left
indicator setting area.
There is a
“calculate another metric” button in the
left indicator setting area, but the
“View [Also Show] Only” option is not
ticked in the filtering display area.
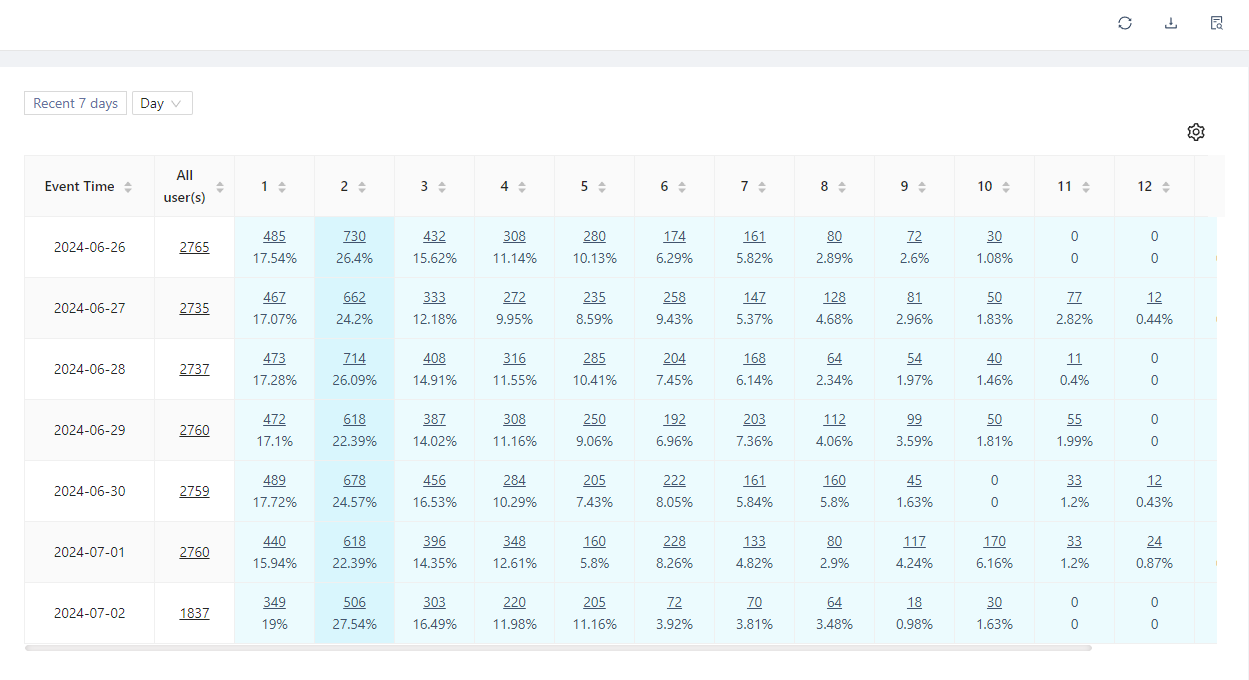
4.3.3.1 Tables
The main structure of the
table
-The first row is the title of
the table, from left to right are the
time of the event, all users (subject of
analysis), interval 1, interval 2
……
-The contents of the table from
top to
bottom are: the number of users in the
interval (the subject of analysis), the
percentage, and the indicators displayed
at the same time.
-When the mouse is
moved to the table, the data logic
corresponding to the cell will be
displayed.
Event Time
-The interval of
event occurrence time is determined
by the analysis period.
-Split and
complete the time period according to
the
granularity of analysis, such as
“2021-09-06 week”, “2021-09 month”.
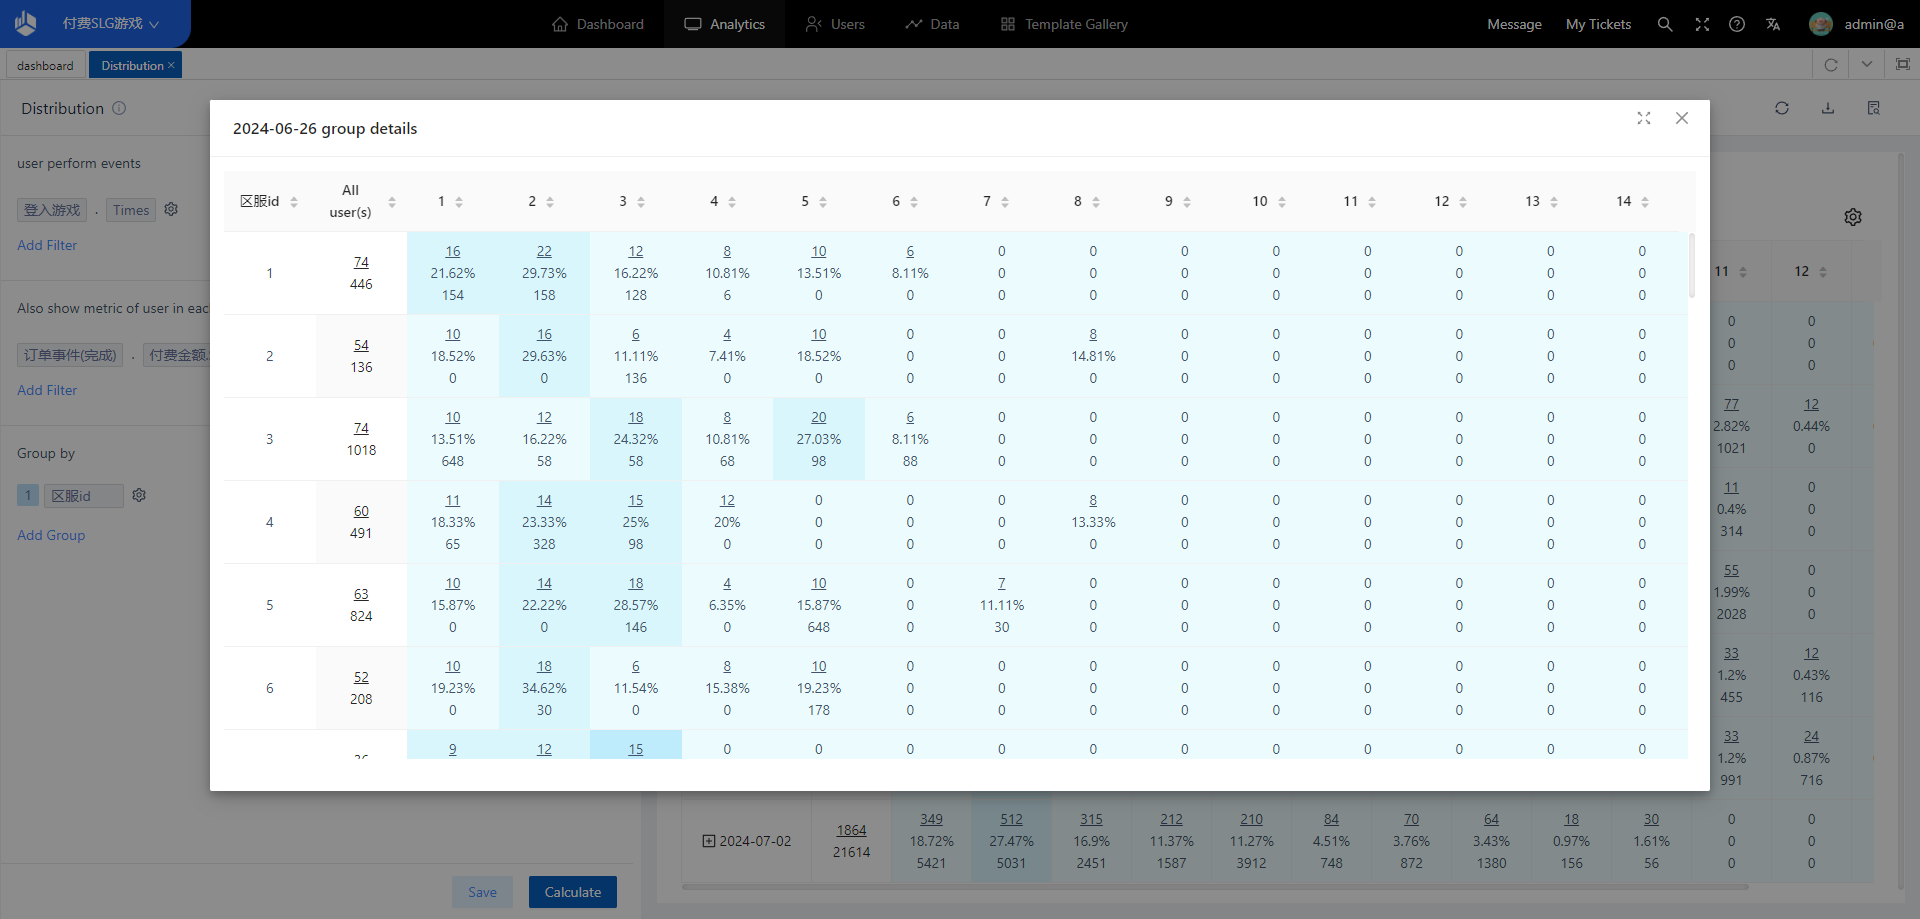
Presentation logic for
grouping
-Grouping items can be put
away
or expanded. When expanding the grouped
items, you can expand the grouped items
under multiple dates.
-Each user’s
group attributes are counted according
to
the attributes at the time of the actual
behaviour.
-Record a total of 1000
possible “date+group” data, with the
option to “download full data in page
format” for complete data.
-Supports
drill down to the user list, which
allows you to underline the user list
and further view the sequence of user
behaviours for a single user.
5. Flows
5.1 The significance of Flows
Path analysis is an exploratory
model that analyses the sequence of
behaviours, behavioural preferences,
critical nodes, and conversion
efficiency.
Path analysis records the
order of user visits during each
session, and then integrates it to
obtain a Sankey diagram of user
behaviour
paths, intuitively viewing the inflow
and outflow of behaviour before and
after
each key node.
It can intuitively
grasp the expansion route of user
behaviour
for optimizing the content of nodes and
improving the overall conversion
efficiency. Using the path analysis
model, you can quickly understand the
primary and secondary factors affecting
the conversion, so as to improve the
product with a purpose.
5.2 Location of Flows
Accessible from the “Flows” page under the “Analysis” module.
5.3 Overview of the Flows Analysis page
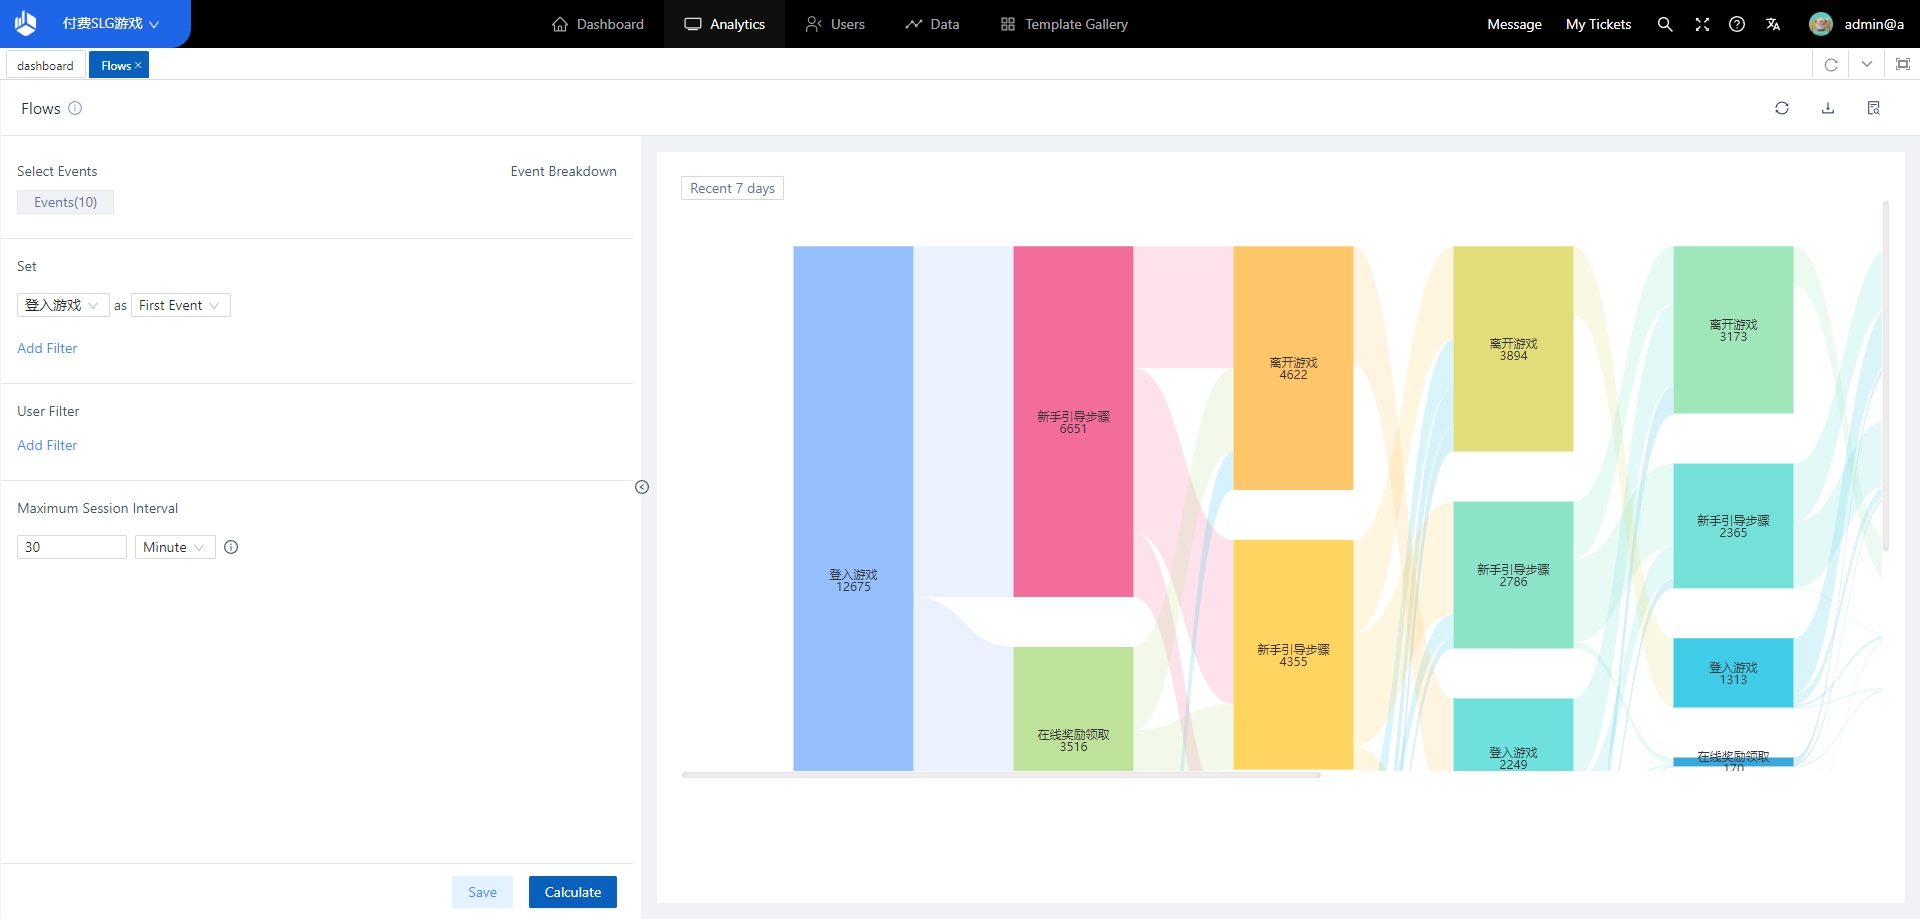
It consists of four parts: analysis angle setting area, display filter area, display chart area, and node detail information.
5.4 Usage Scenarios for Flows
5.4.1 Definition of terms
Analyse Event Groups
Default
10 events and maximum 30 events can
be selected to participate in the route
analysis. Unselected events are invalid
events and do not participate in the
calculation and display of path
analysis.
[Objects for
analysis].
Selects an item in the
analysis event
group as the basis for analysis, and you
can specify it as the initial or end
event to be analysed. By default, the
first starting event is
selected.
Session interval
If the
trigger interval between two consecutive
valid events (belonging to the analysis
event group) is within the set time,
they are considered to belong to the
same session.
[Path].
The path is
expanded forward or backward (determined
by the beginning or end of the
analysis) based on the object to be
analysed. The paths will be independent
of
each other and fully
exhaustive.
[Number of
displays].
When a node on the
path is in the following cases, it will
be merged into the “more” module in the
chart.
Note: A node will be merged
into “More” if the number of nodes in
that
node is more than the 7th highest in its
class.
5.4.2 Analysing the conditions of the angle-setting zone
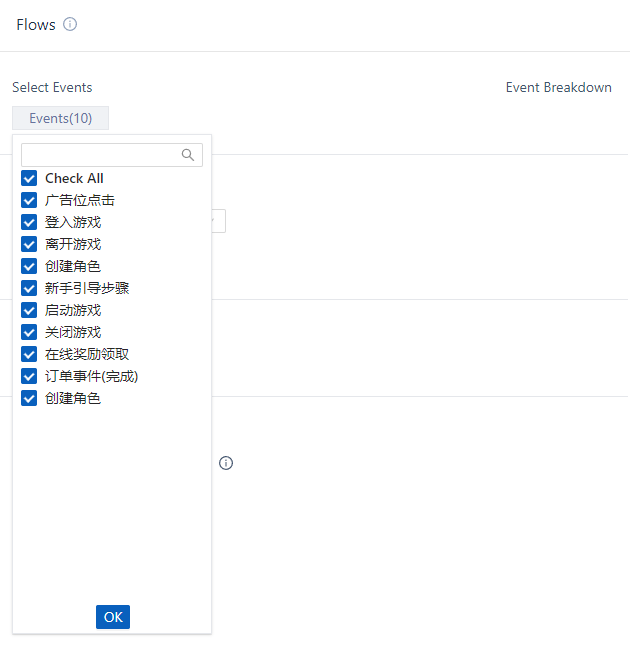
5.4.2.1 Events analysed with participation
The first 10 items are selected by default, up to 30 items can be selected, support the search function
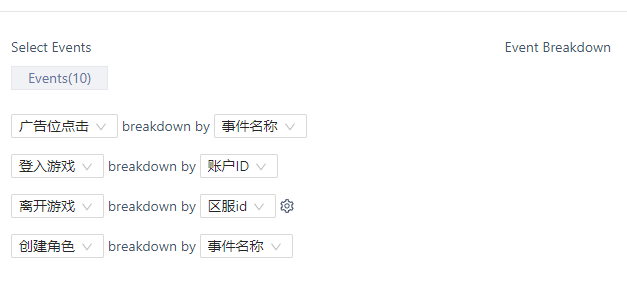
5.4.2.2 Setting Group Split Criteria for Events
An event split option can be added for the selected group of Events Involved in Analysis. At this point:
- Any event in the group can be split according to an event attribute of the event.
- Each event can only be split by one attribute, i.e. the selected event cannot be selected again.
- Each event in the group can be split.
- Numeric, temporal or list attributes can be set to intervals, and the attribute interval groups share the configuration with the interval groups of other models.
5.4.2.3 Selection of events for analysis
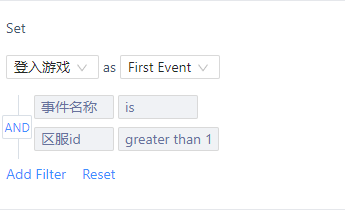
Selection of analyses and setting of filter conditions
- The mode of analysis can be selected from the initial event or the end event.
- Filter conditions can be added to the event attributes of the event.
- Filter conditions can be analysed from the perspective of the data type.
5.4.2.4 Session interval settings
The meaning of session interval
is: The maximum time between
neighbouring events when
selected.
Modify this value to adjust
whether the
neighbouring events are in the same
session.
The default setting is “30
Minutes”, and the unit can be “Seconds”
(160), “Minutes” (160),
“Hours “(1~24)
5.4.3 Setting of Screening display area
Default selection is the last 8 days
5.4.4 Setting of Chart display area
5.4.4.1 Lost or starting displays
- when analysing the start event, there is no lower level node at a step, then that node will appear to be lost
- when analysing the end event, a step has no upper level nodes, then the node will appear to start
5.4.4.2 Components of “more”
When the node is “more”, it is equivalent to the set of general nodes, and the selected lines are the set of lines, values and flows of all the constituent nodes.
5.4.4.3 Horizontal scrollbar with left and right drag
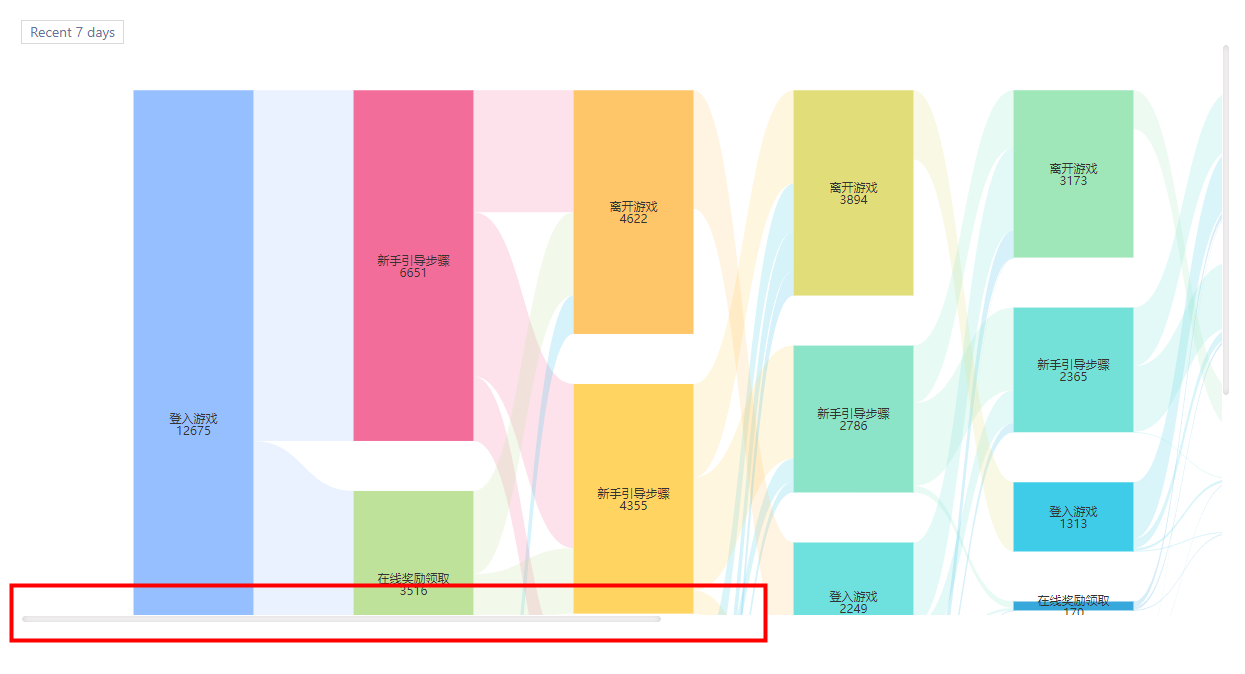
Up to 10 levels can be
displayed, with the default display
showing
the initial event or the end event
(depending on the choice).
More
information can be displayed in the
screen by dragging the horizontal
scrollbar.
5.4.4.4 Node Path
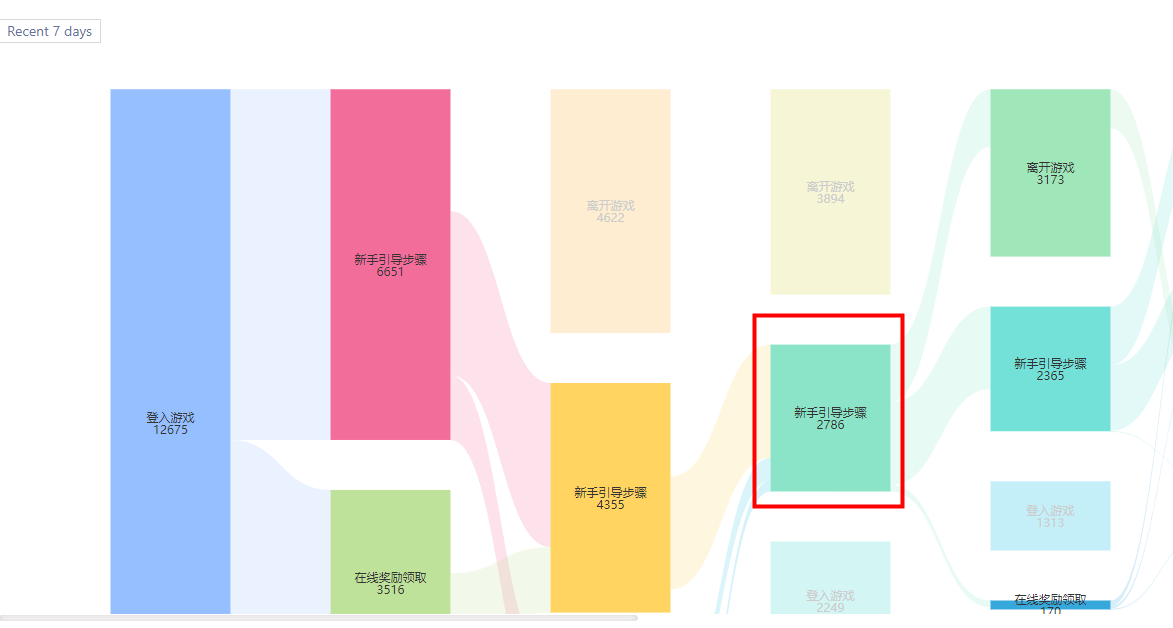
When clicking on a node, you can highlight the relevant path or display the node information details of that node.
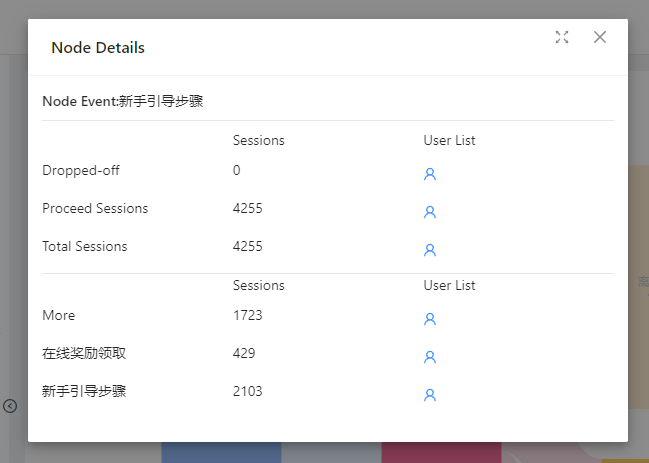
When viewing node details, clicking on the number of users information will display a list of eligible users. And the related user behaviour sequence can be queried
6. Interval
6.1 The significance of Interval
Interval analysis can be used to analyse the time interval between events to understand how often a core user behaviour occurs, or as a complement to funnel analysis, where you can get a more detailed view of conversion durations in addition to analysing conversion rates between steps.
In the interval analysis, you can get answers to the following questions:
- How long does it take, on average, for a user to sign up and pay for an icebreaker?
- Is there an anomaly in the elapsed time from opening the app to actually getting to it, and is there a problem with the installation package from one of the channels?
- How long does a user need to reside in the first chapter before moving on to subsequent chapters?
6.2 Location of Interval
Select “Interval” from “Analysis” in the top navigation bar to access the Interval Analysis model.
6.3 Overview of the Interval Analysis page
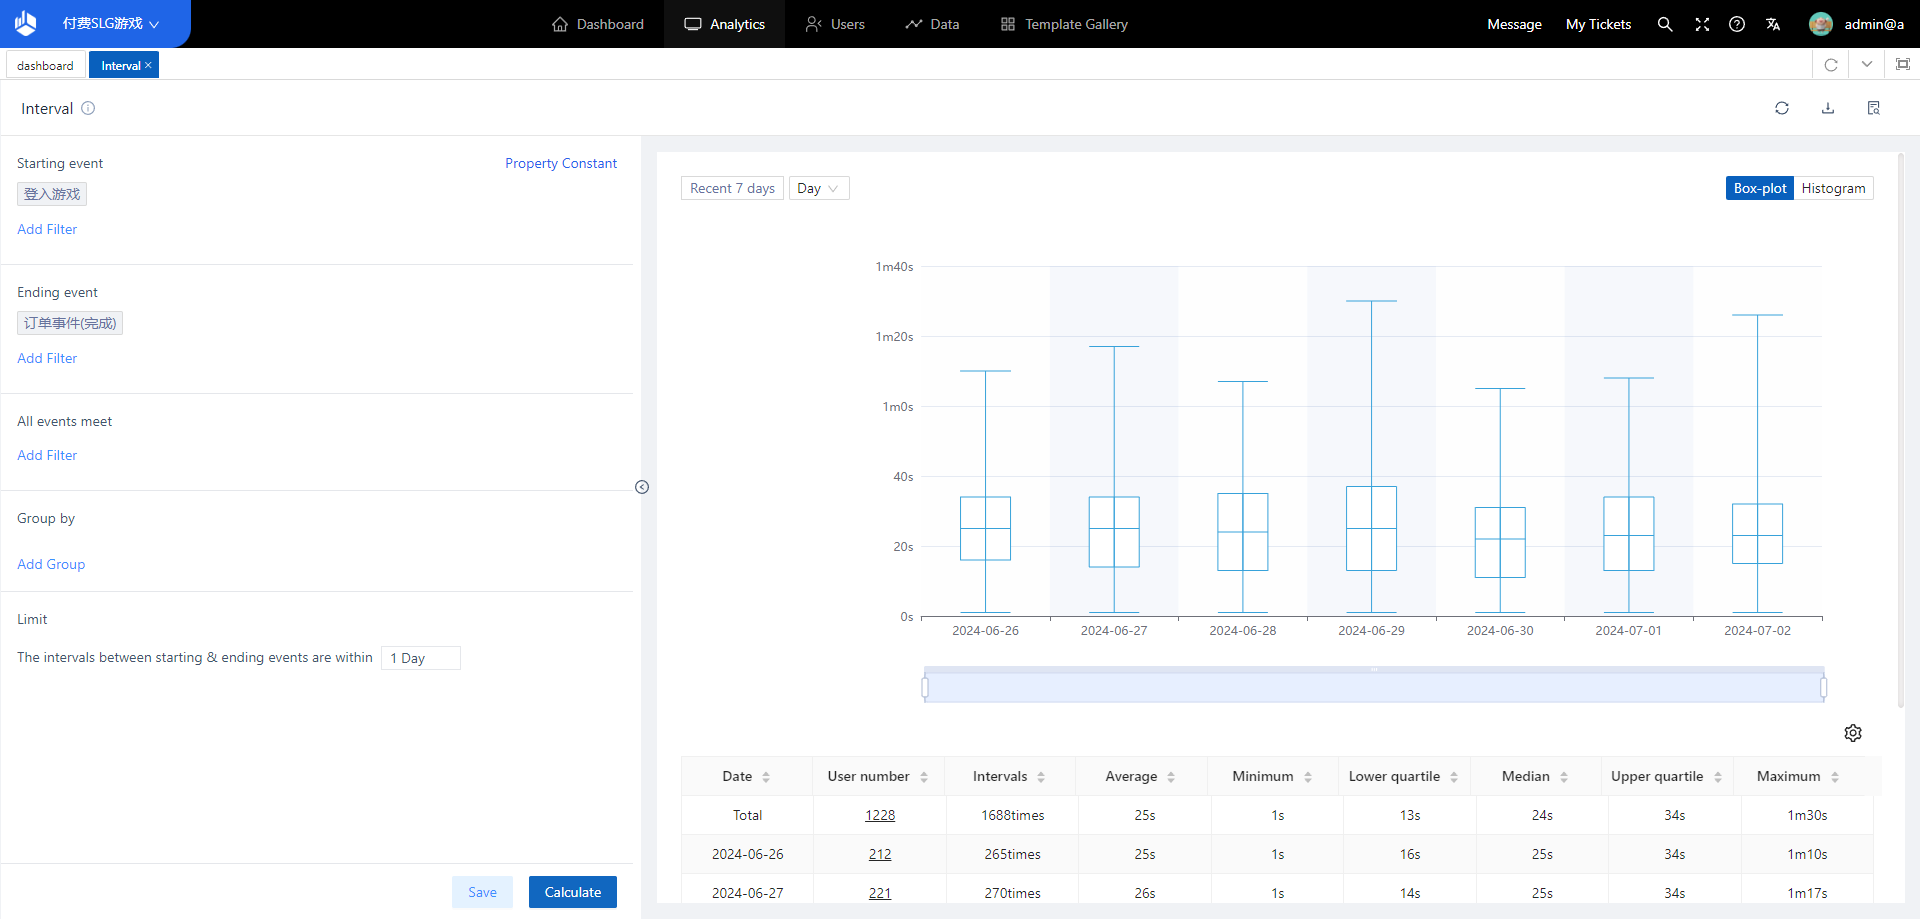
In interval analysis, you need to select the analysis subject and the start event and end event. Only when the same analysis subject completes the start event and the end event in sequence will it be regarded as one interval.
6.4 View interval statistics
Interval analysis offers two chart types that you can choose from depending on the purpose of the analysis
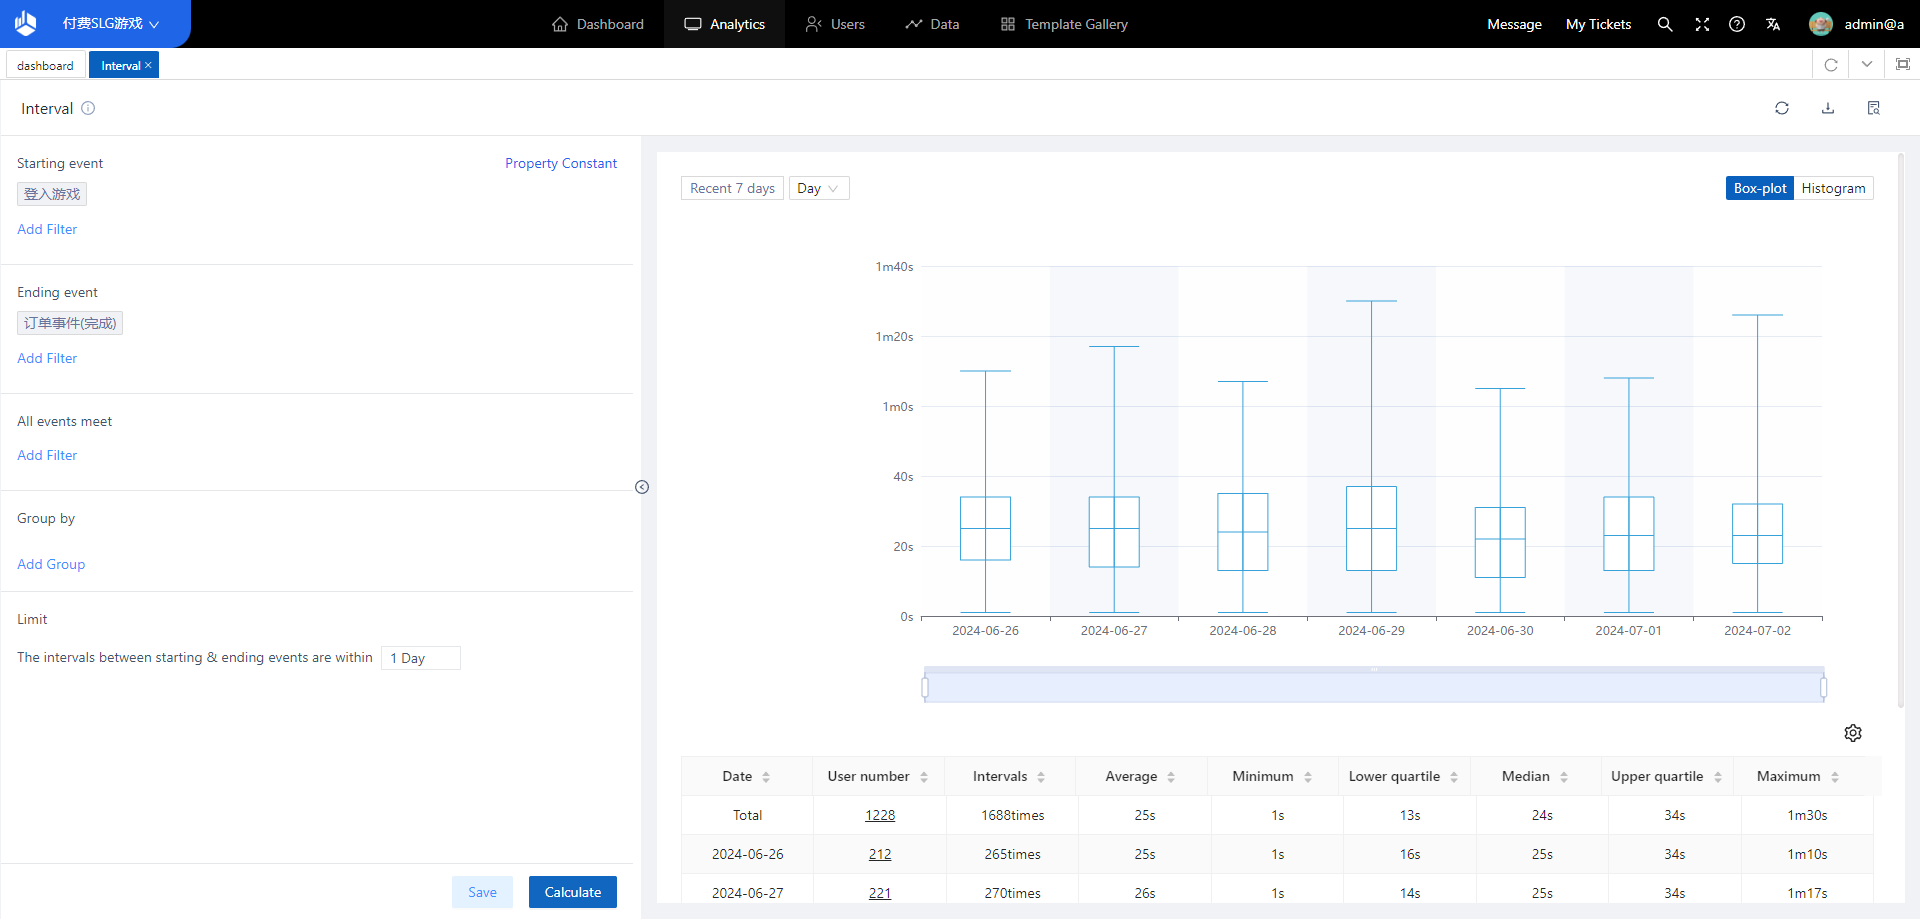
- Box-and-whisker plot
If you wish to see aggregated statistics for event intervals, such as maximum, upper quartile, median, lower quartile vs. minimum, you can select the box-and-whisker plot display. If you select a time granularity other than aggregate, the box-and-whisker plot will show the variation with date.
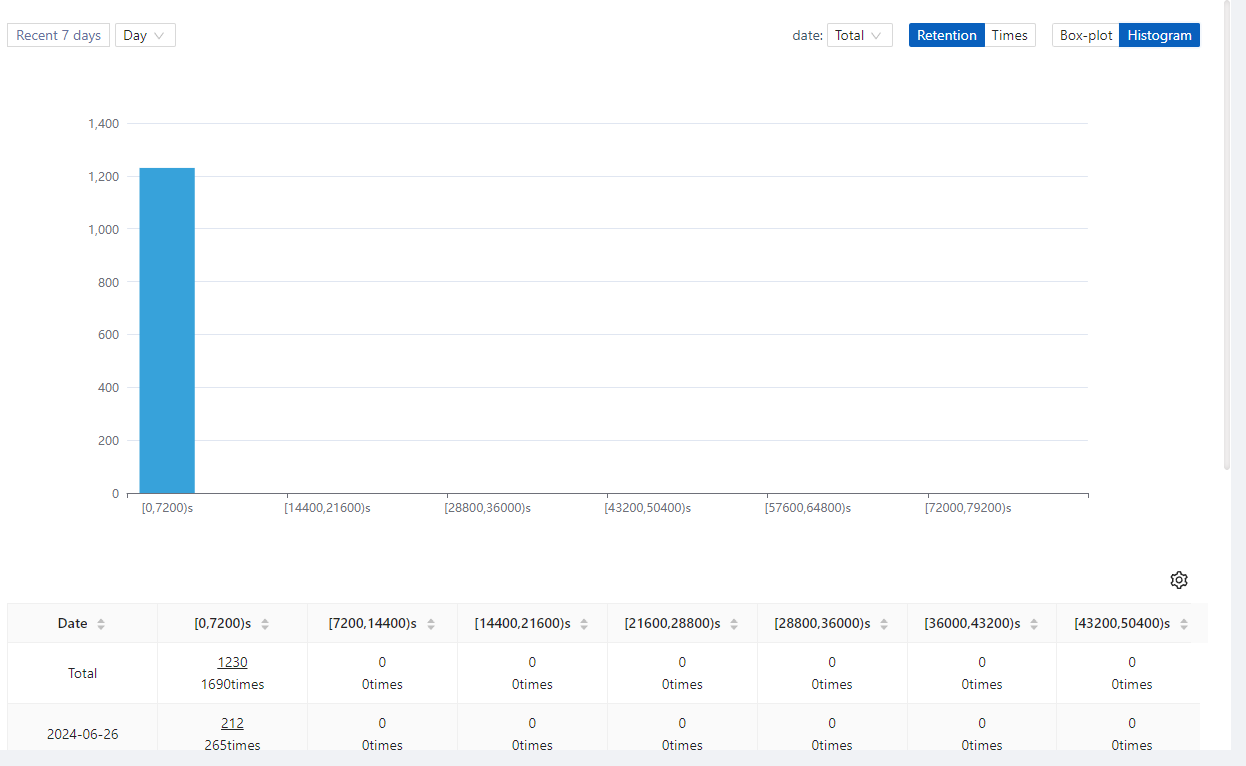
- Histogram
If you wish to see the statistics of the distribution of event intervals, you can choose the histogram display.
7. LTV
7.1 Significance of LTV analysis
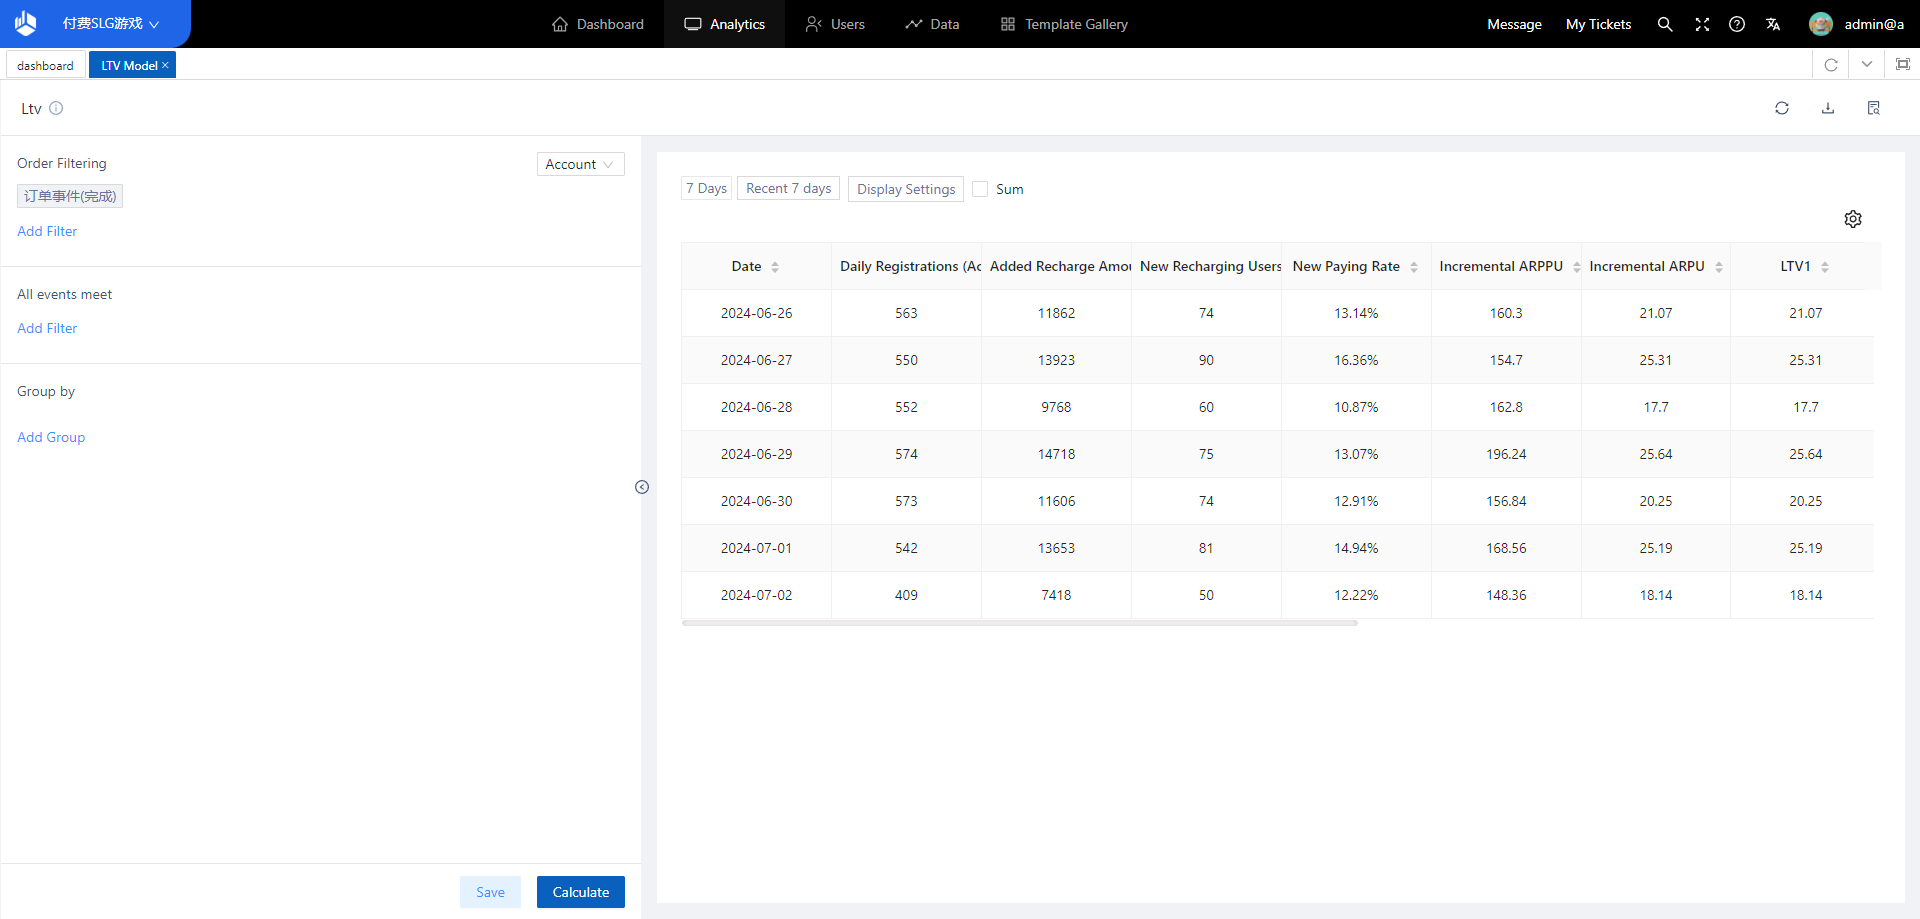
LTV analytics is an analytical model for analysing the business value of users, which analyses the per capita value contributed by a group of users visiting on a specific date for a certain length of time.
四、Users
Based on Users, you can create segments or tags to help with analysis in addition to using user attributes for analysis.
Attribute AnalysisIt is a model dedicated to analysing the statistics and distribution of user attributes, through which you can quickly grasp the user profile of a specific user group, providing help for refined operation, such as comparing the cumulative paid amount of the average value of users in different channels, or viewing the number of users by the user’s current level and the VIP level of the split to view the number of users.
CohortsIt supports the formation of user groups of people with common characteristics, macroscopic understanding of the group characteristics of various groups of people and microscopic insight into specific user information, and facilitates the segmentation and analysis of user samples in a variety of models, such as finding users who have topped up their account in the past 30 days or those who have not had any events in the past 7 days (churned users).
TagsIt supports calculating user data in a specific way, and the tagged value can be regarded as a special user attribute, such as the number of login days in the last week or the recharge amount since the opening of the service. The tag also supports daily automatic backup, which is convenient to view the historical trend of the number of users corresponding to the tag value, such as the change of the number of big Rs in the game.
user searchIt is easy to find specific users using user attributes as filtering conditions, such as customers searching by account ID, or finding a group of users for subsequent marketing recalls by registration time.
User Behaviour SequenceIt is possible to dig deeper into the behaviour of individual users to understand user behaviour at the micro level and combine it with better analysis at the macro level (analytical models).
1. Attribute Analysis
1.1 The significance of attribute analysis
Attribute analysis is a model that specialises in analysing the statistics and distribution of user attributes. The model categorises users according to their attributes and can simultaneously view the statistics and distribution of users with different grouping values. For example, it can view the distribution of users in each province, the age distribution of users, and so on. The user profile of the overall user group can be quickly depicted. Multi-angle, omni-directional grasp of the characteristics of the designated user groups, macro grasp of the composition and preferences of the overall user, so as to provide the basis for the refined operation.
1.2 Location of attribute analysis
Accessible from the Attribute Analysis page under the Users module.
1.3 Page overview of Attribute Analysis
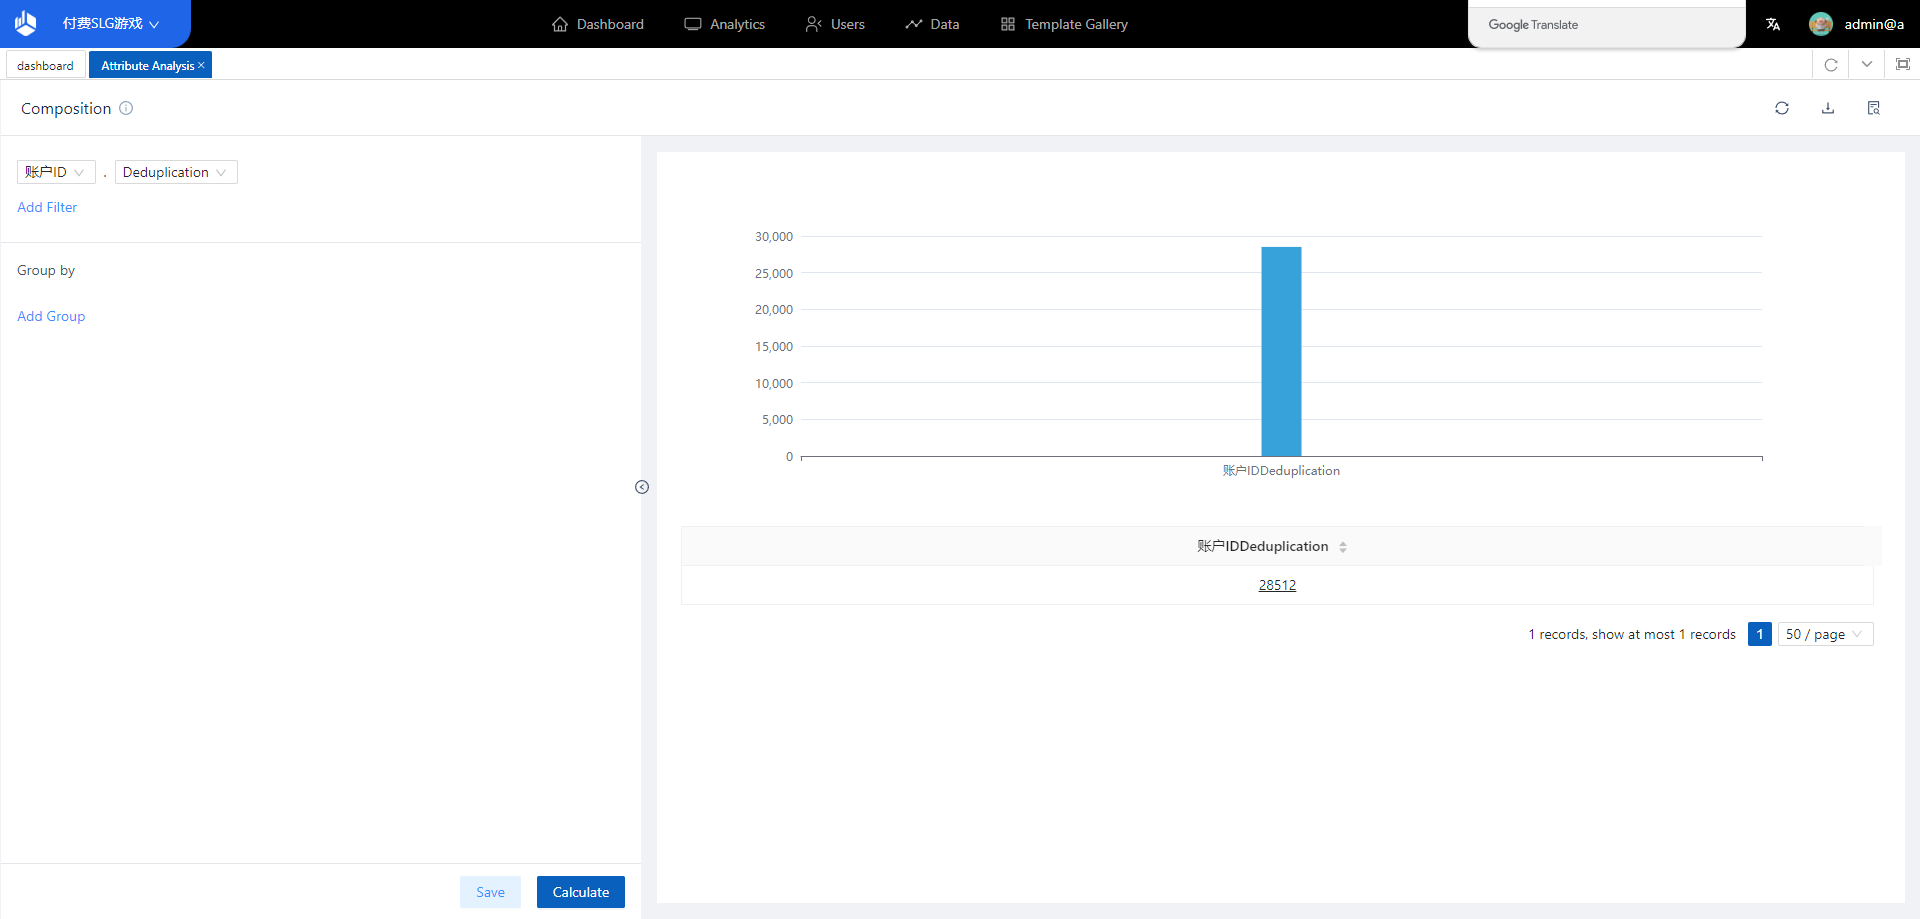
By “analysis angle setting area”, “display filter area”, “display chart area”, “table details area”. Four parts
1.4 Scenarios for the use of attribute analysis
1.4.1 Conditions for analysing attributes
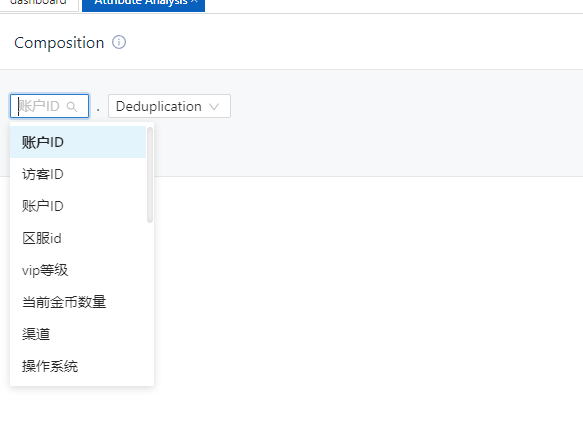
The content that can be analysed
is the number of users, user
attributes of a certain analysis
perspective
Note: If you select the
number
of users as the analysis attribute, you
can click on the user list in the table
area.
1.4.2 Group by
The default is no grouping, in which case the entire user population is analysed directly without distinguishing between them.
2. Cohorts
2.1 The significance of Cohorts
By forming user groups from people with common characteristics, it is possible to understand the group characteristics of various groups of people and gain micro insight into specific user information, and to facilitate the segmentation of user samples for analysis in various models.
- Conditional subgroups: user subgroups obtained by filtering specific behavioural conditions or user attributes.
- ID Segmentation: Generate user segments by uploading ID files based on the content of the uploaded fields.
- Result Segmentation: User segments obtained by using the results of the analysis model.
- SQL segmentation: user segments are created by querying the results of SQL statements.
2.2 Location of Cohorts
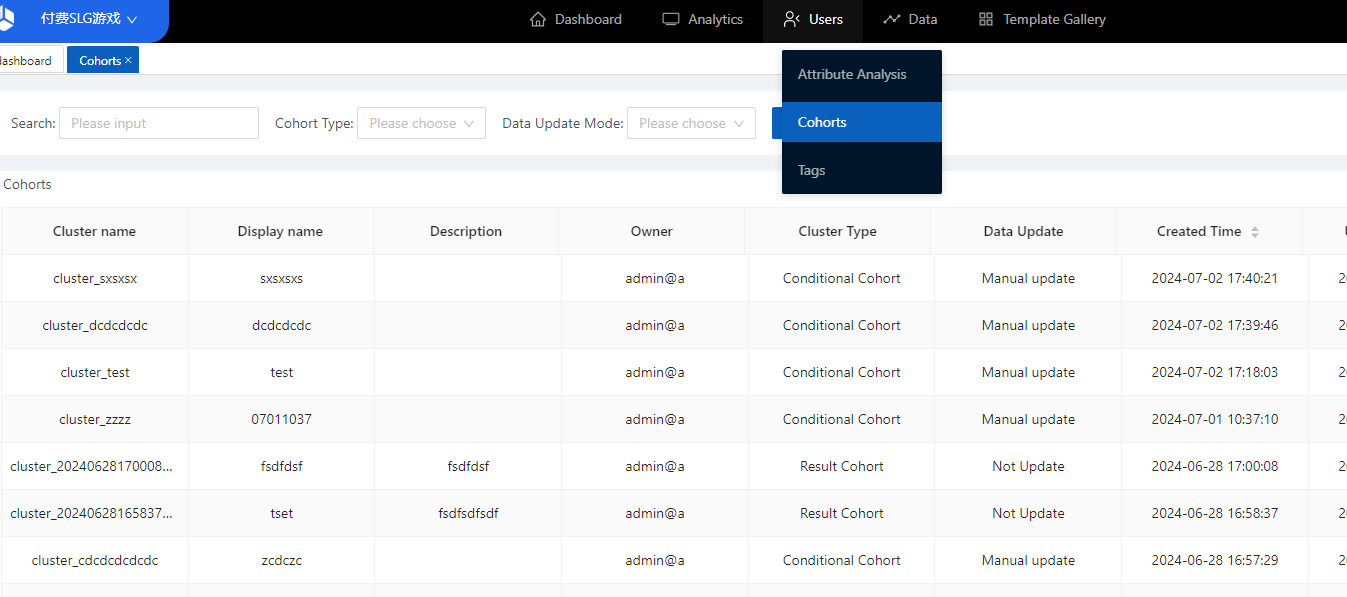
Users who have the privilege to view user groups are accessed from “User Analysis - User Groups”.
2.3 Page overview of user segments
2.4 User Segmentation Usage Scenarios
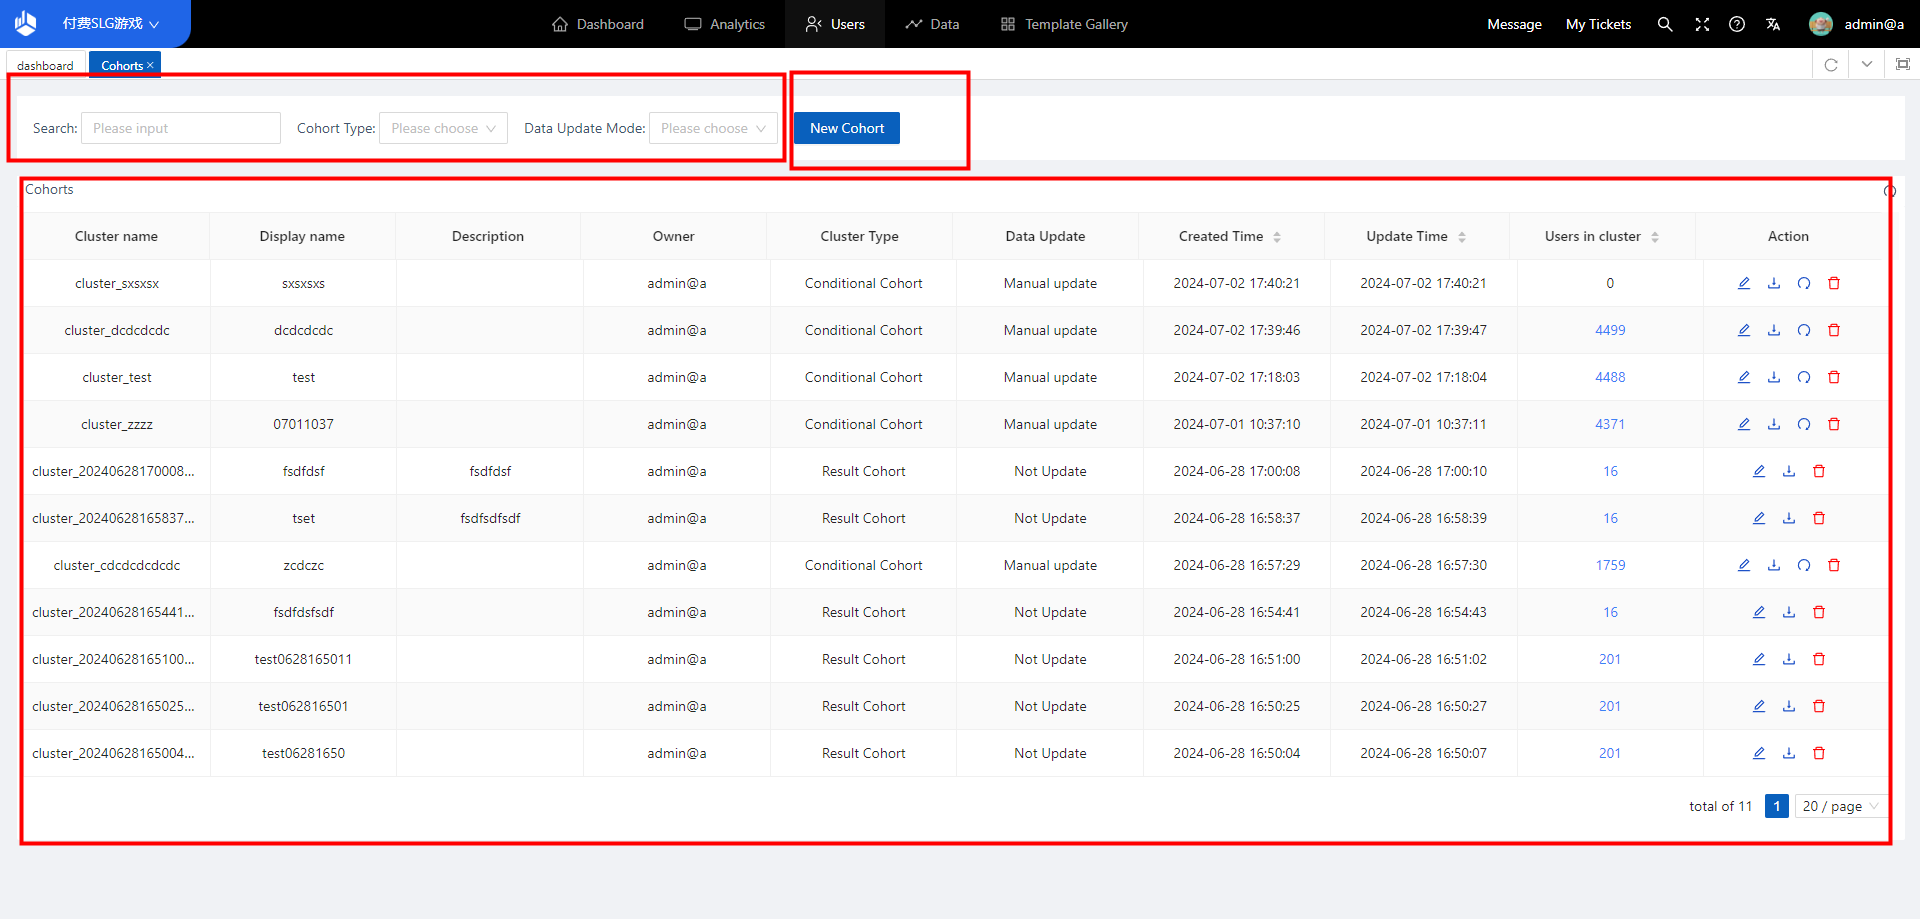
2.4.1 List of subgroup base information
The list of subgroups will
display subgroup name, display name,
subgroup note, creator, subgroup type,
data update, creation time, update time,
number of users, and operation
column.
Click “User Group Number” to
view the
list of users (analysis subject)
corresponding to the subgroup, and
“Operation”
column can be set up differently
according to different subgroup types:
| cluster types | action items |
|---|---|
| Conditional Grouping | Edit/Download/Refresh/Delete |
| ID Grouping | Edit/Download/Refresh/Delete |
| SQL Cluster | Edit/Download/Refresh/Delete |
| Result Subgroups | Edit/Download/Remove |
Note: Members with relevant permissions within the project can view user groups created by other users and the corresponding user lists, but can only edit or delete user groups they have created.
2.4.2 Conditional Cohort
2.4.2.1 New conditional Cohort
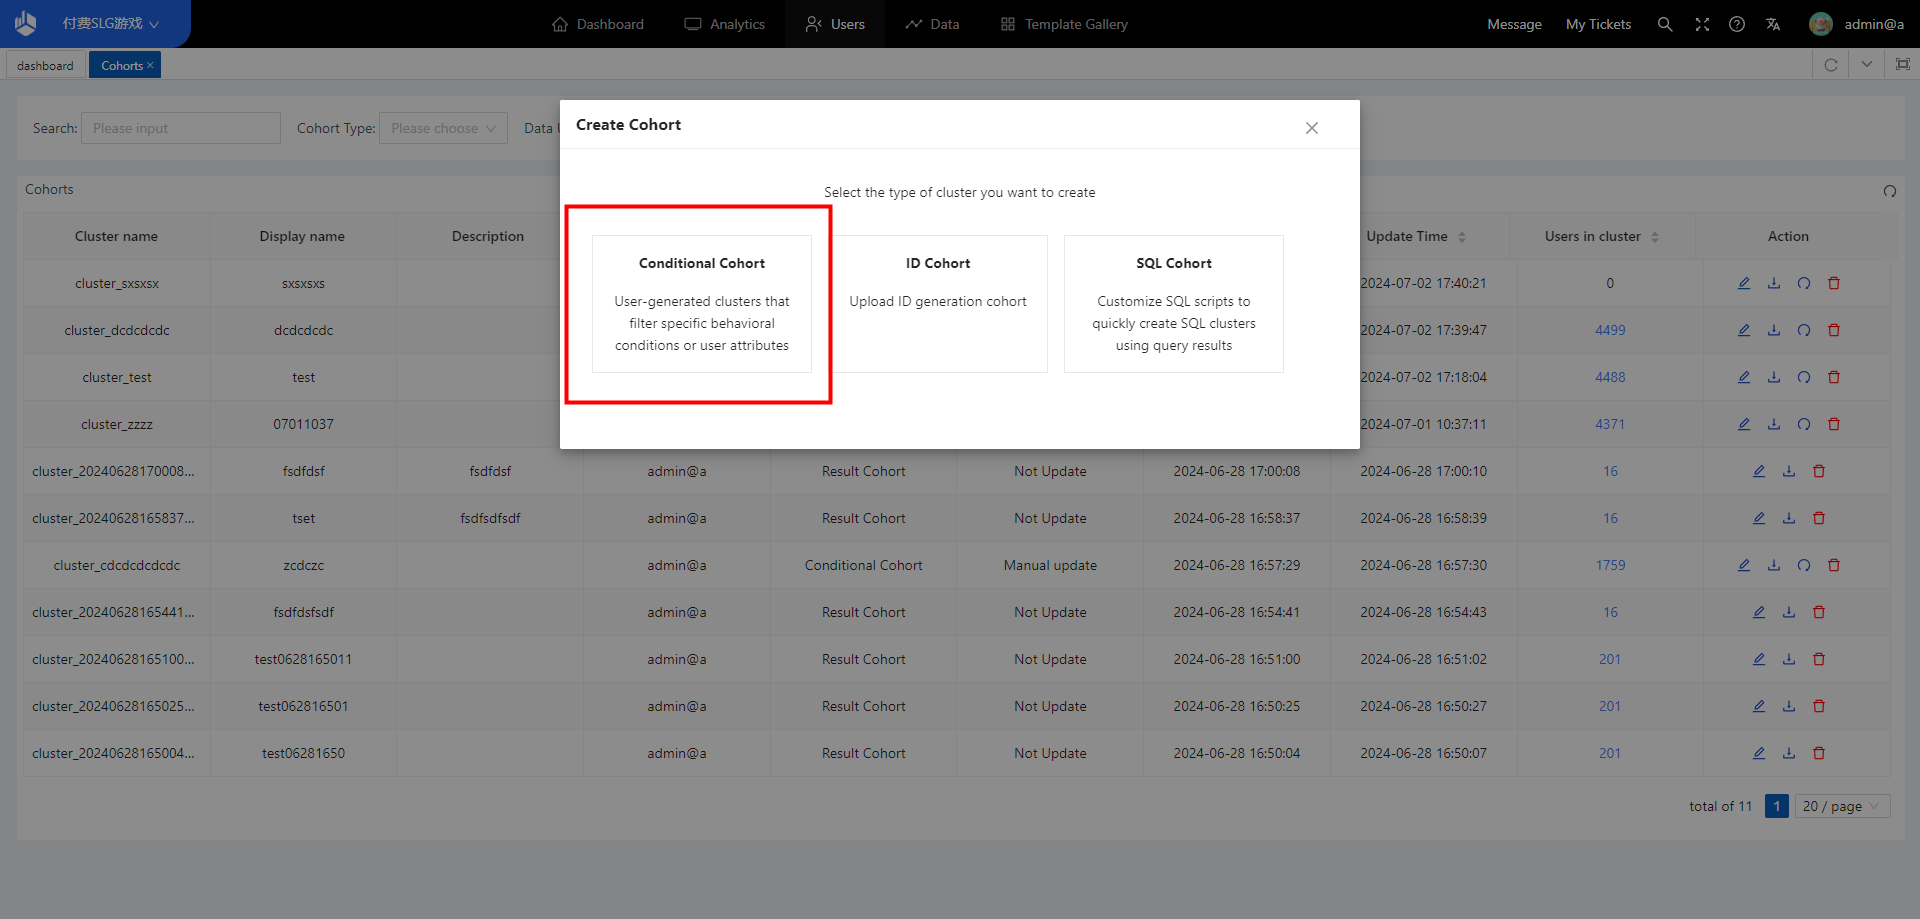
Click “+New Subgroup” at the top right of the subgroup page, and select “Conditional Cohort” (note that there is an upper limit for user groups, and they cannot be created when the upper limit is reached).
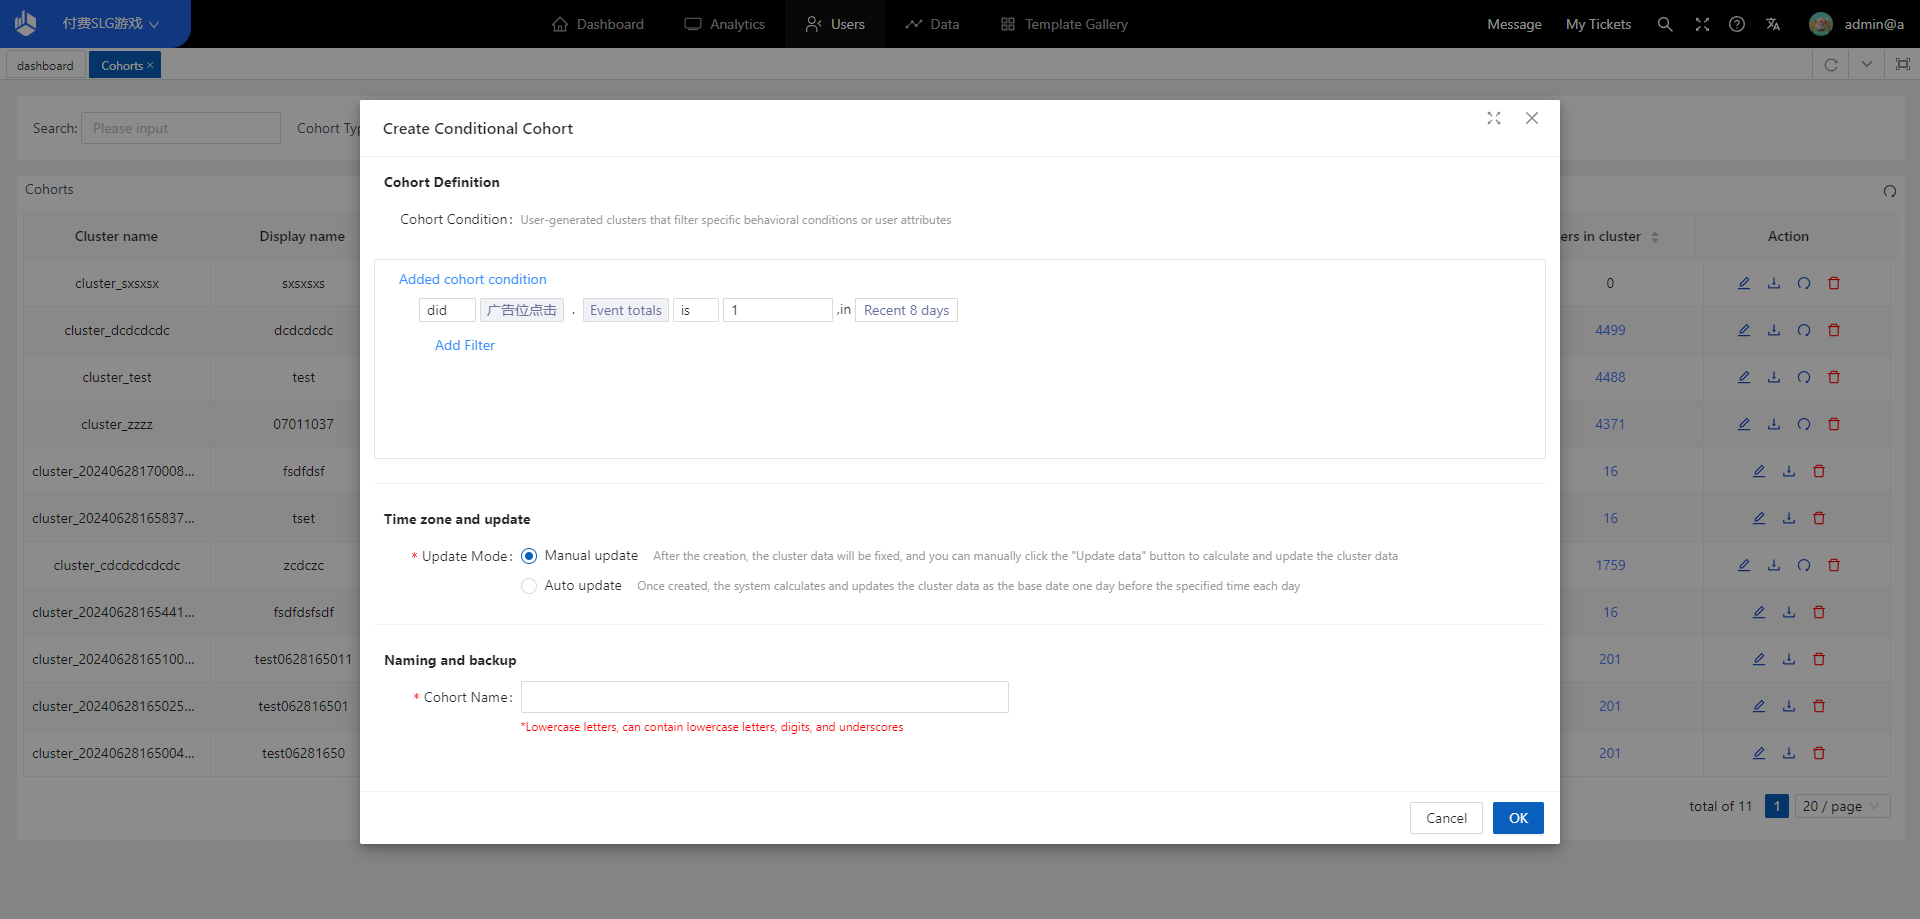
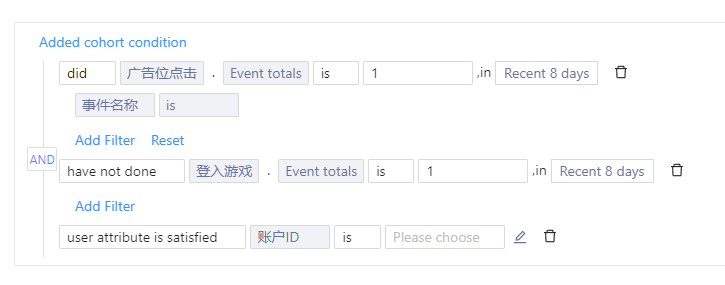
- Grouping conditions
There are three types of conditions that can be added: events that have been done, events that have not been done, or user attributes that are satisfied, and you can add any one of them.
Conditional Cohort can choose between two update methods, “manual update” and “automatic update”:
- Manual update” means that after the first calculation, the system will not update the user group automatically, users need to update manually.
- “Automatic update” means that after the Cohort is created, the system will calculate and update the Cohort data at the specified time of the day, using the previous day as the base date.
2.4.2.2 Viewing, editing and deleting conditional Cohort
- You can enter the group settings page to check the conditions of the group.
- General users can only edit and update their own usergroups.
- General users can only delete the subgroups that they have created, the delete button will not be displayed for the groups that they have not created and they cannot be deleted.
2.4.3 ID Cohort
2.4.3.1 New ID Cohort
Click “New Cohort” at the top right of the group page and select “ID Cohort”.
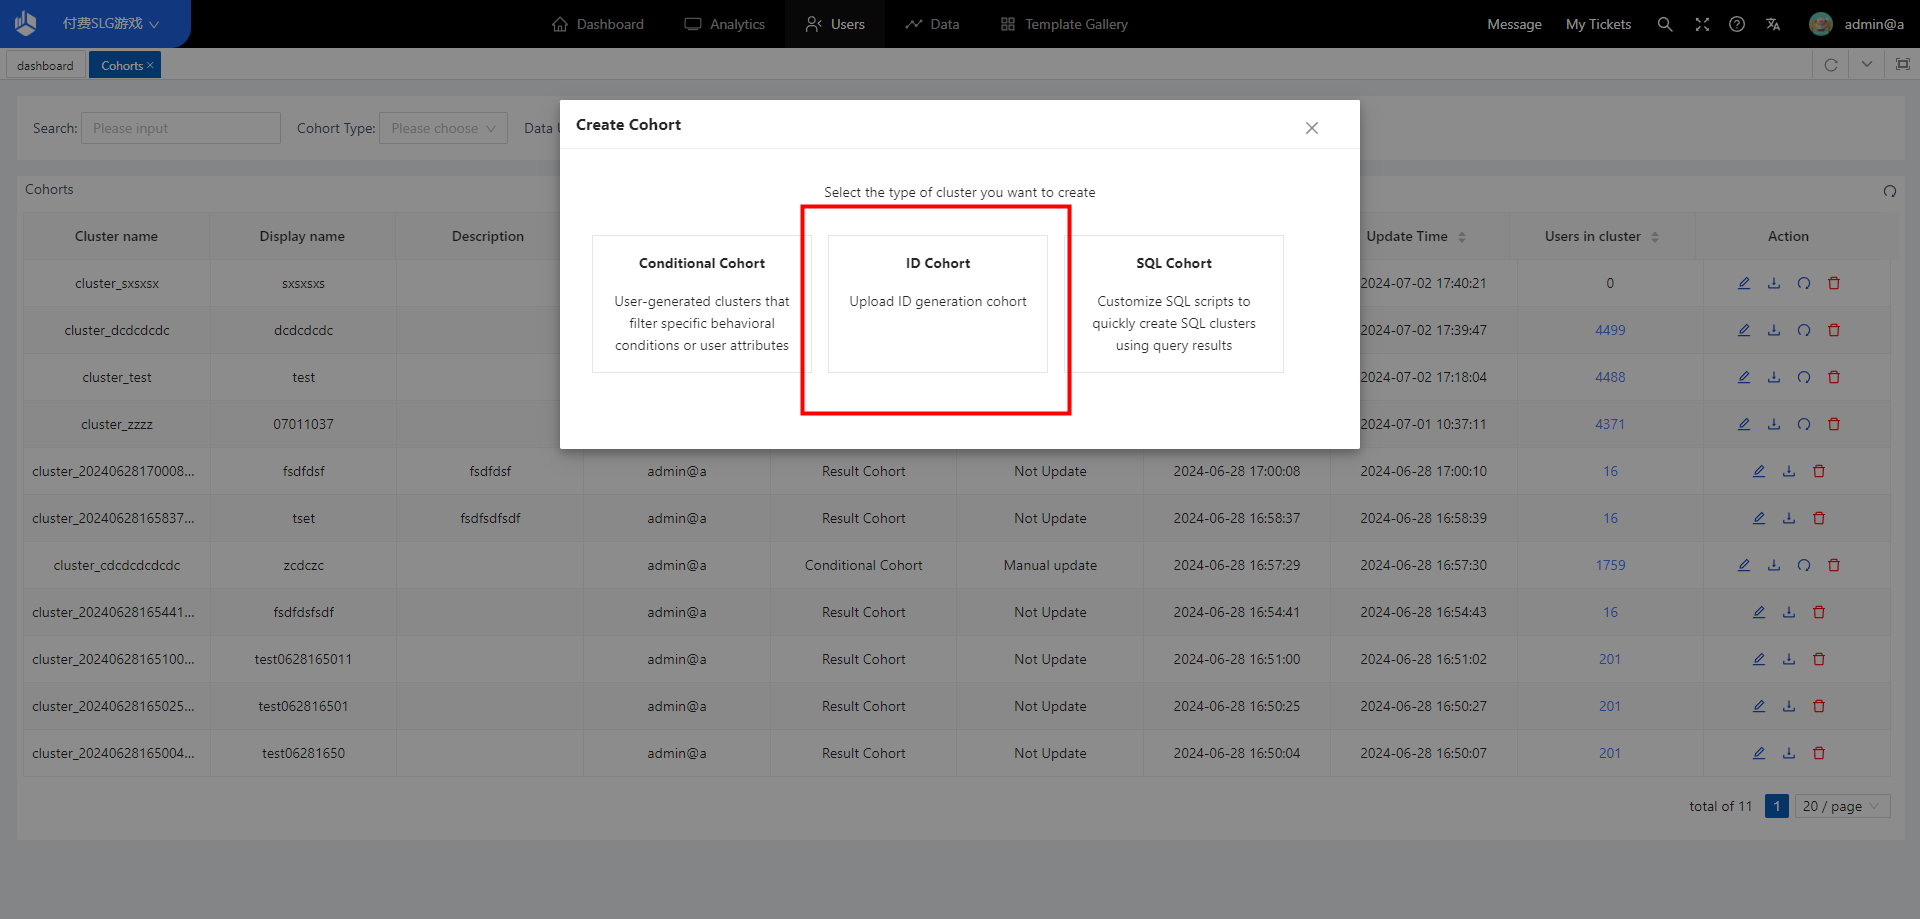
Go to the creation page and
upload the file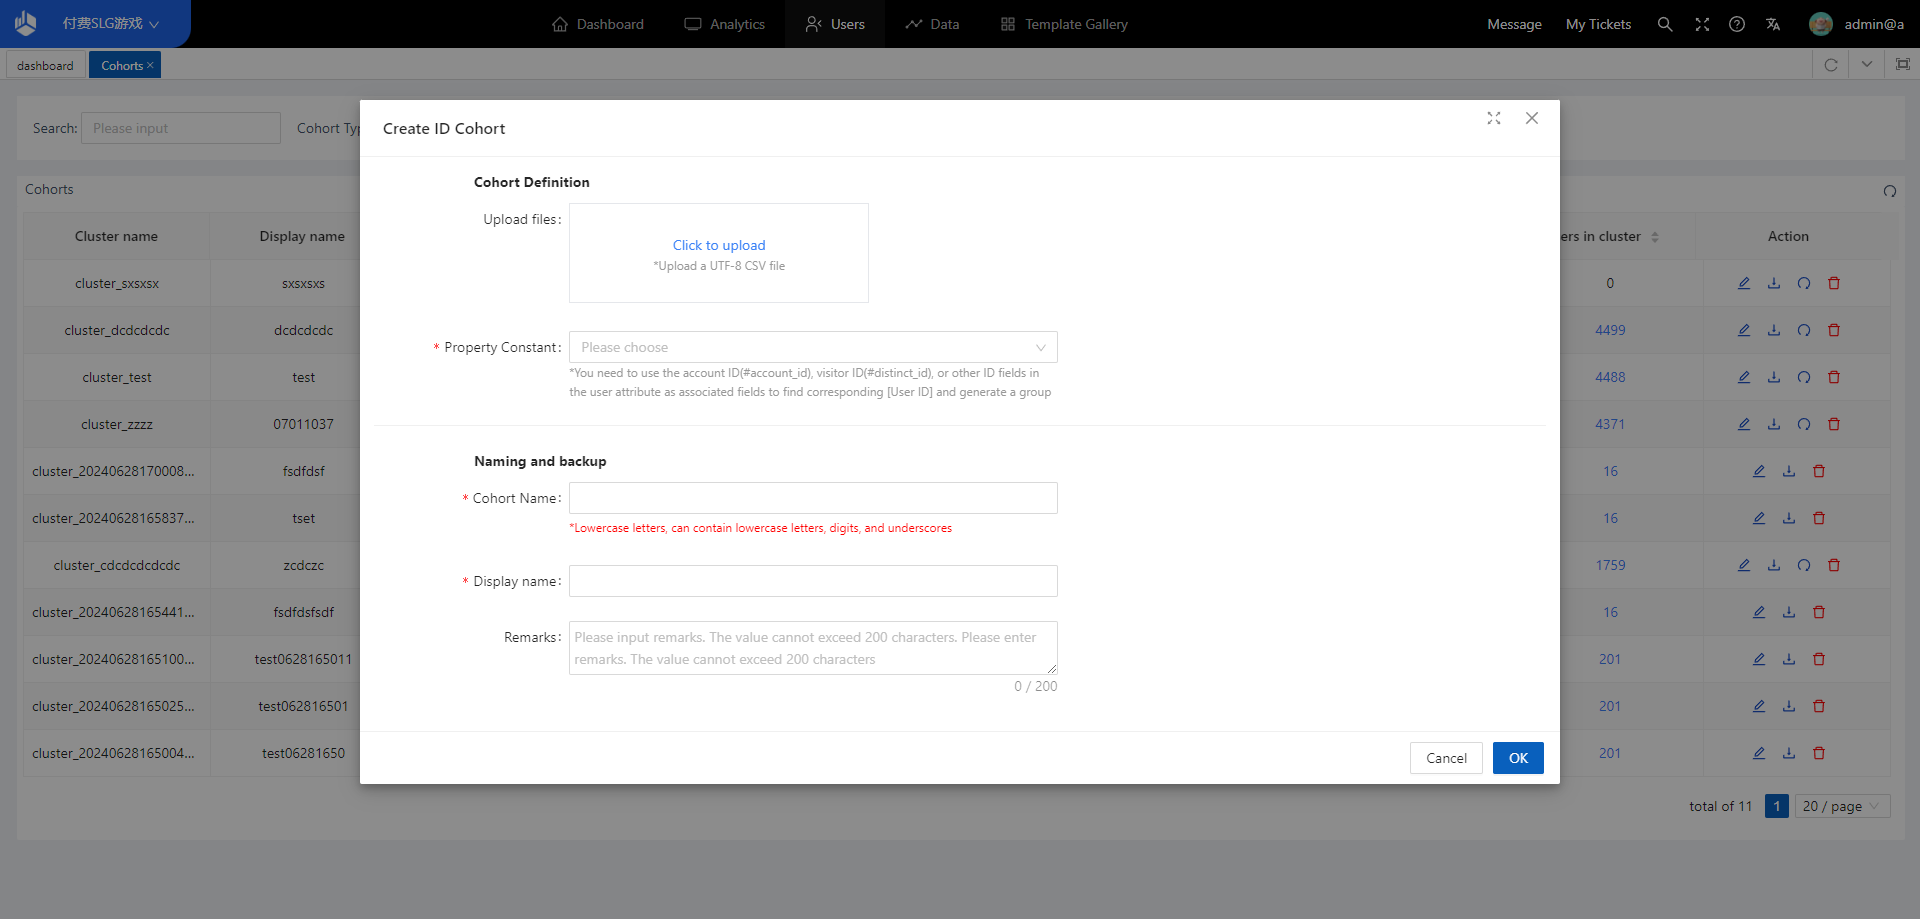
- The format of the uploaded file should be as follows: one ID field per line in the ID file, recorded in UTF-8 encoded CSV text format.
- ID upload type label, can not set
the “update method” and “backup
method”.
You can select a user attribute (numeric or text type) as the associated field to judge the user, and any user ID that matches the value of the selected user attribute at the time of upload (the first column) will be assigned the corresponding tag value.
2.4.3.2 Viewing, editing and deleting ID Cohort
- You can enter the subgroup settings page to check the conditions of subgroups.
- General users can only edit and download their own ID Cohort.
- General users can only delete their own ID Cohort, user groups not created by them will not show the delete button and cannot be deleted.
2.4.4 Result Cohort
2.4.4.1 New Result Cohort
In the event analysis model, if
you are counting the number of
triggered users, you can create Cohort
in the results table by clicking on
“Create Result Cohort”.
In the case of the path analysis model, you need to click through to the node details before the Create Resulting Cluster button appears.
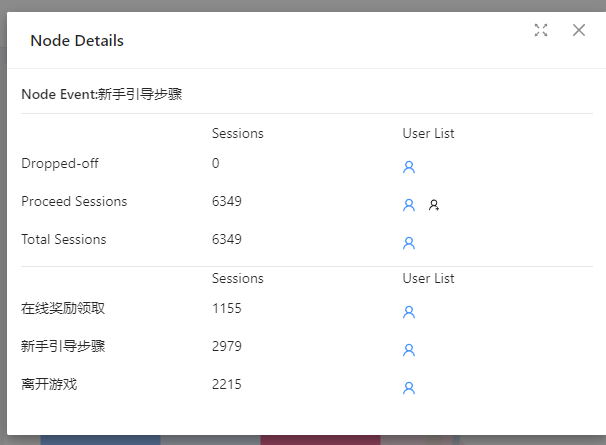
For other models, such as retention analysis, you can click on the Create Outcome Cluster button wherever it appears in the table.
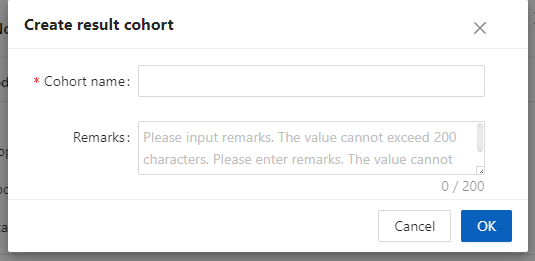
- When creating a subgroup, you can
set the name of the results
Cohort and a
note to describe the results
Cohort.
2.4.4.2 Editing and deletion of Result Cohort
- Result Cohort can not modify the creation rules and update methods, only the name of the Cohort and notes.
- General users can only delete the result Cohort they created, user groups not created by them will not show the delete button and cannot be deleted.
2.4.5 SQL Cohort
2.4.5.1 New SQL Cohort
Click “New Cohort” at the top
right of the group page and select
“SQL Cohort”.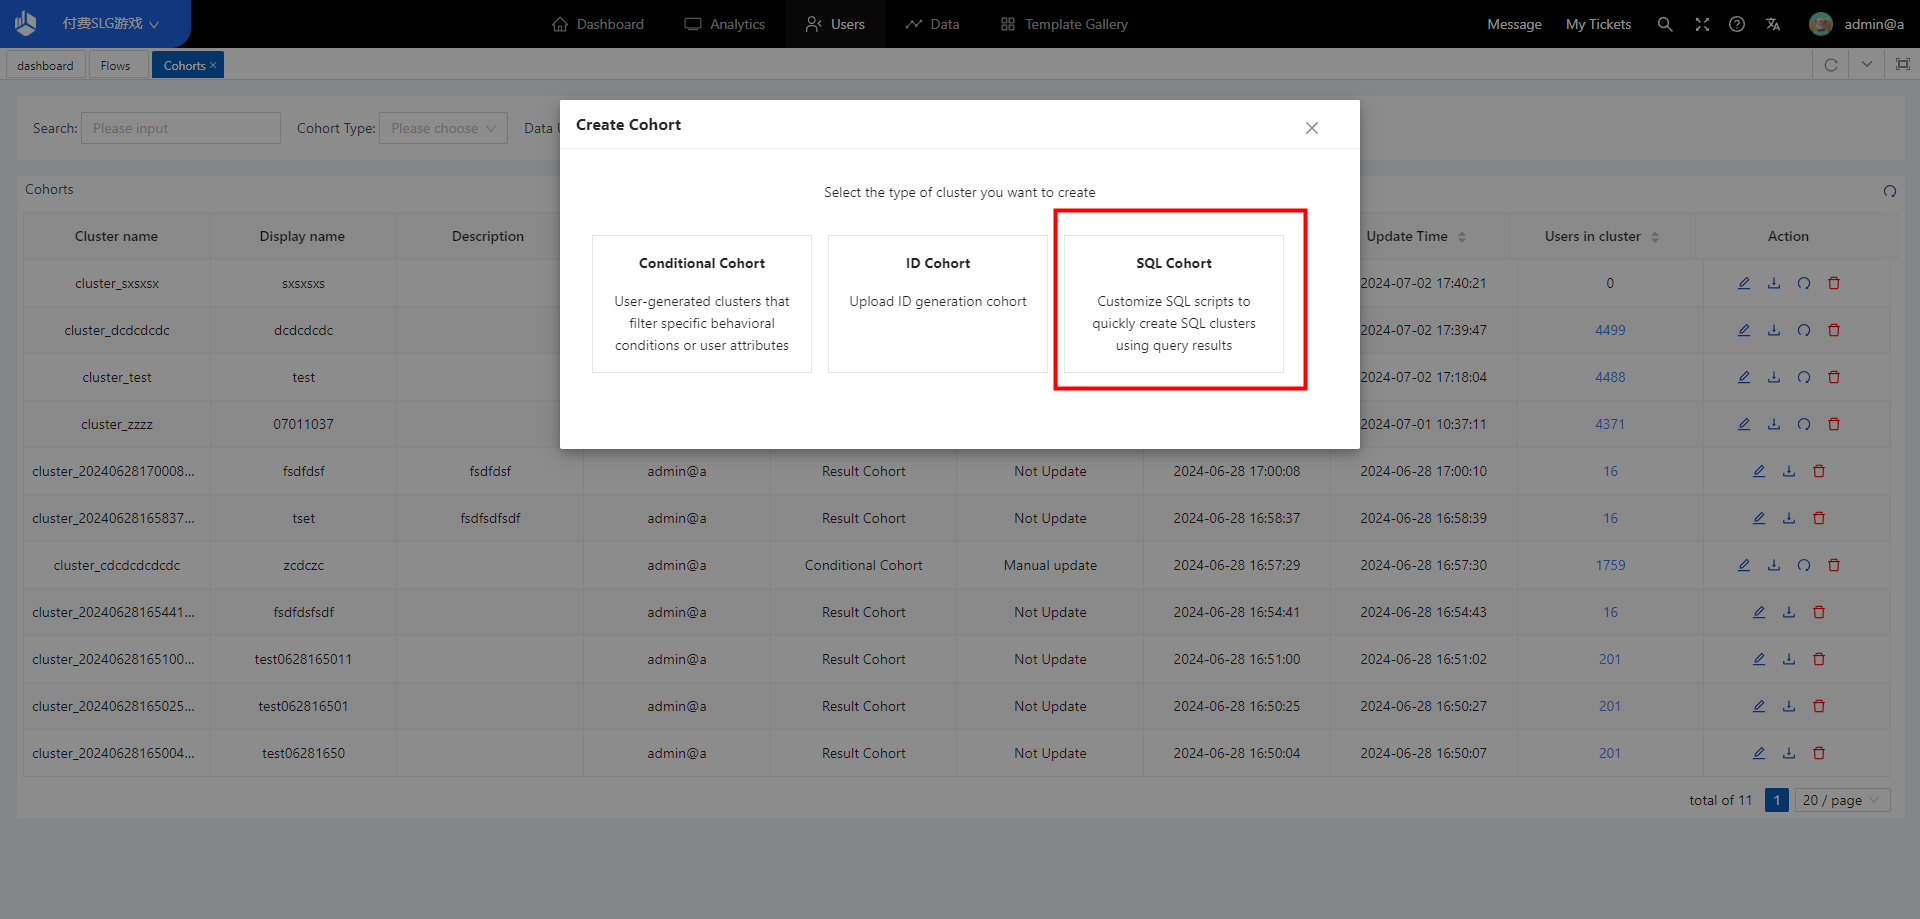
-
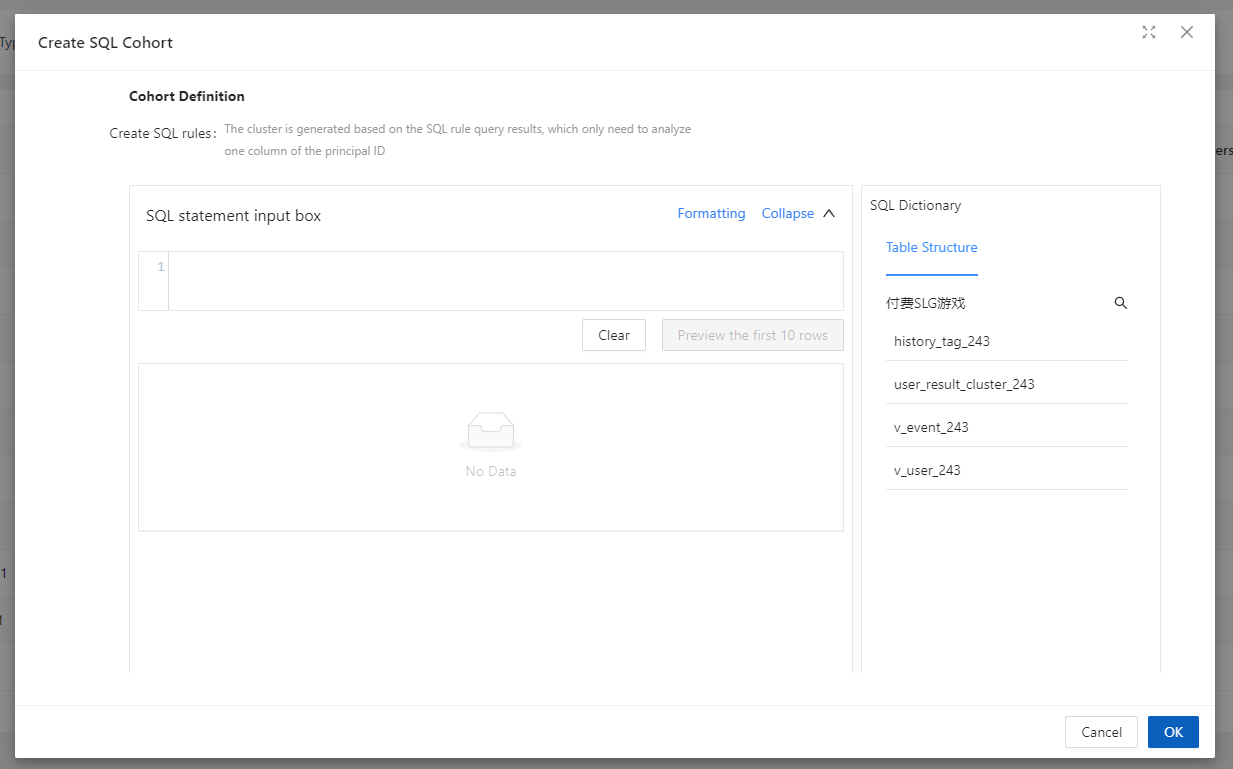
Create SQL Rules
According to the required logic, write the corresponding statement in the SQL statement input box, and the SQL Cohort will be generated based on the SQL rule query result. -
SQL Dictionary
On the right side of the creation interface, SQL dictionary is provided, which is convenient to view the current available table structure, including event table, user table, dimension table, temporary table, etc., and copy the corresponding field names or parse them directly.
SQL Cohort allows you to choose between two update methods, “Manual Update” and “Automatic Update”:
- Manual update” means that after the first calculation, the system will not automatically update the user group, users need to update manually.
- “Automatic update” will calculate and update the user group based on the base date after 0 o’clock on the server.
2.4.5.2 Viewing, Editing and Deleting SQL Cohort
- You can enter the group settings page to check the conditions of the group.
- General users can only edit and update their own user groups.
- General users can only delete their own SQL Cohort, the delete button will not be displayed for user groups not created by them, and they cannot be deleted.
2.4.6 User Cohort List
Click “User Cohort size” of a subgroup in the subgroup list to enter the user list page, which displays the user list information of the eligible users.
3. Tags
3.1 The significance of Tags
The Tags is a collection of people with a certain set of characteristics, and the tagged value is a collection of “a group of similar people”, which can be easily structured by the label and tagged value.
For example, if the Tags is “Paid User”, there are three groups under the label with label values of “Big R”, “Medium R” and “Small R” respectively. Under the label, there are three groups with label values of “Large R”, “Medium R”, and “Small R”.
Through a certain creation
method, the users with similar
characteristics are aggregated by
characteristic value and then form a
label,
which is convenient for segmentation
analysis in various models.
1、Provide
a
variety of creation methods, suitable
for more in-depth user group drill-down
analysis.
2、Multiple similar
populations in the same dimension form a
label,
and each population is treated as a
label value to achieve the connection
between related populations.
3、Tags
can be created for different dates of
the
historical version (backup), you can see
the number of users with different tag
values with the date of change
4、Tags
can be switched to different analysis
subjects, corresponding to different
calculation logic and analysis
scenarios.
3.2 Location of Tags
Users with Tags viewing
privileges enter from “User - Tags” to
set
up Tags.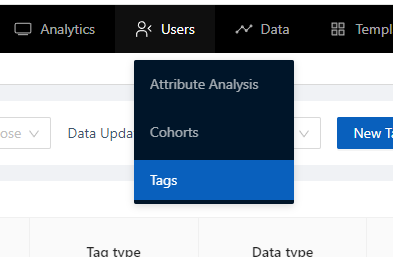
3.3 Overview of pages with Tags
Click the “New Tag” button and
select a label type.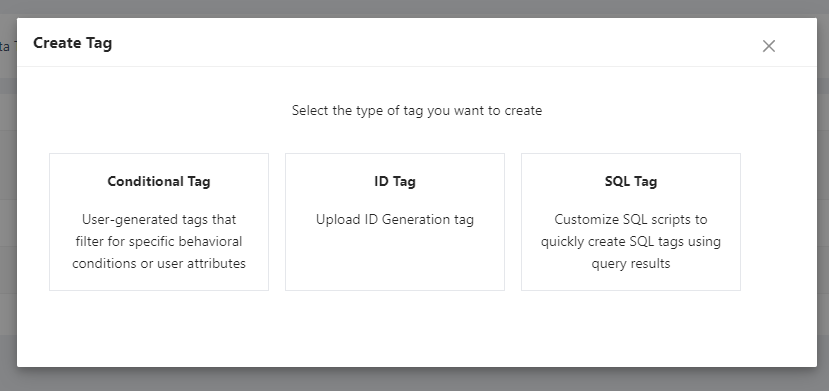
Complete the entire label
creation process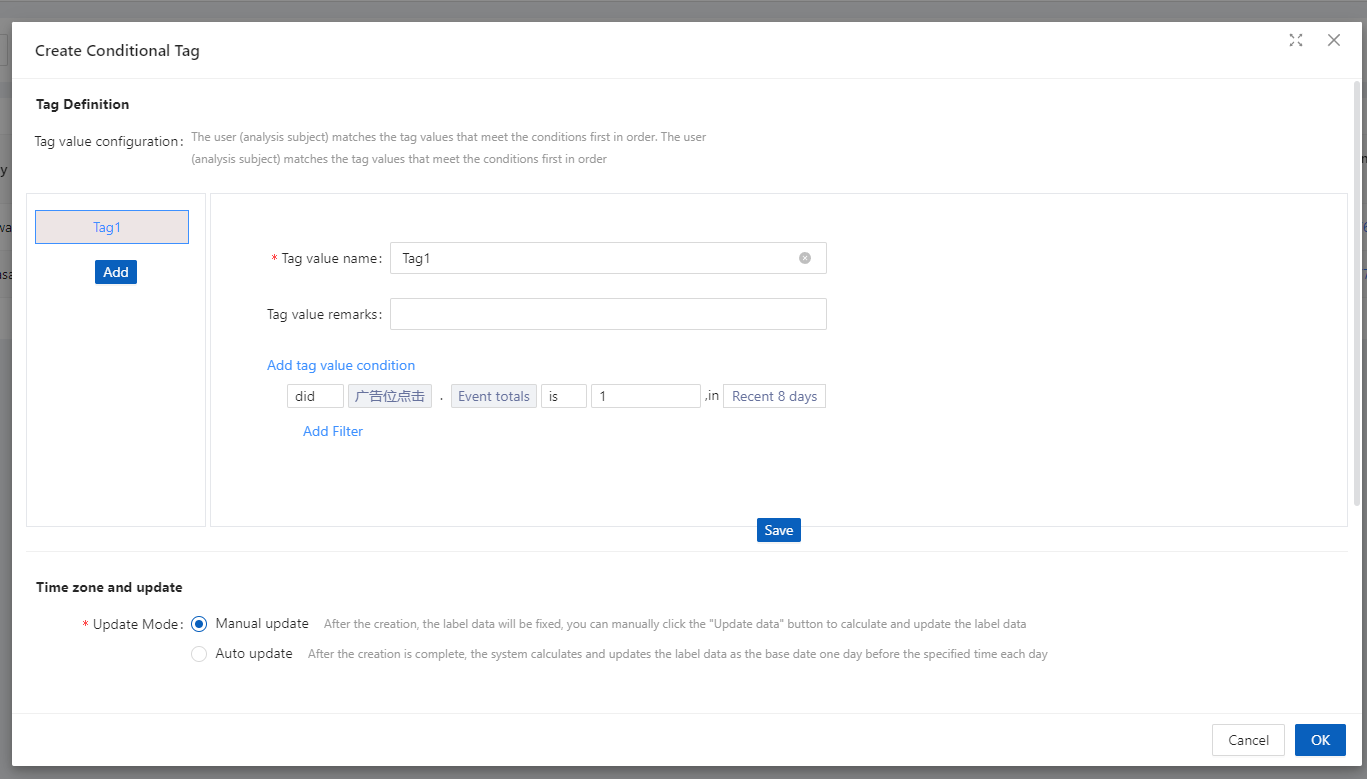
See how different users are
tagged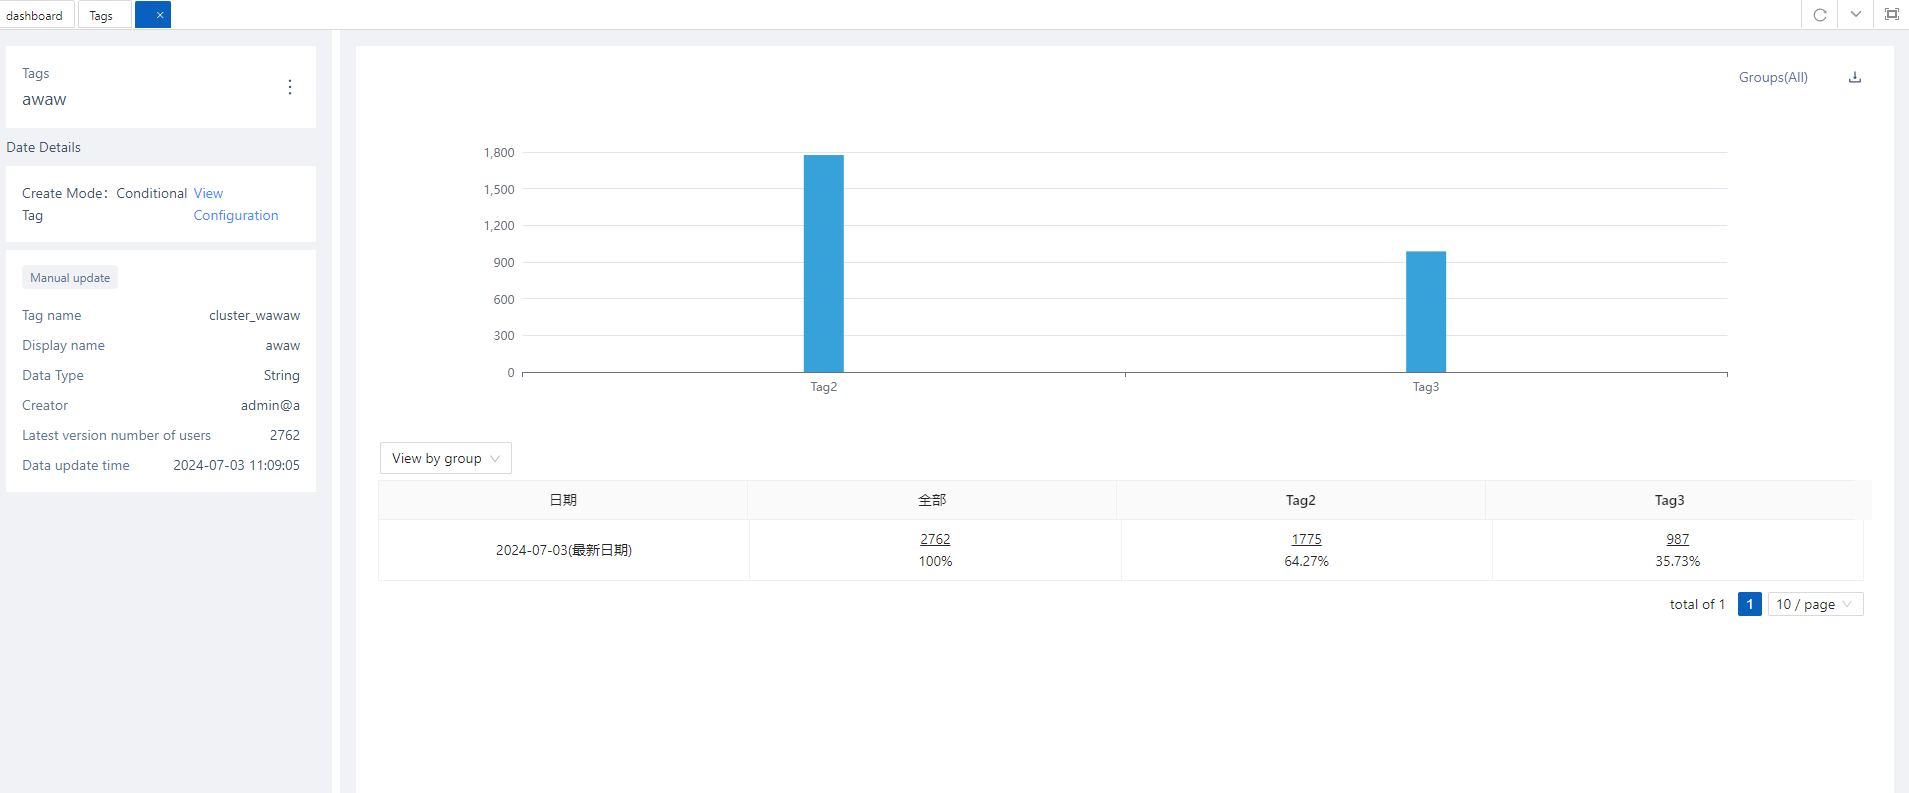
Use of labels in model
filtering, grouped item viewing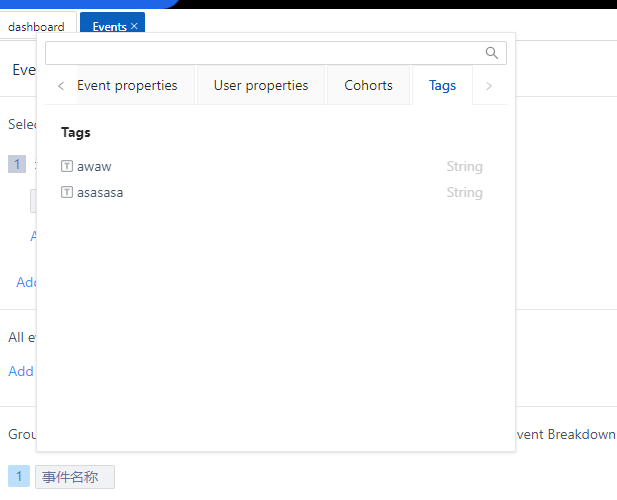
3.4 Scenarios for the use of user tags
3.4.1 User tags and tagged values
User label is a set of “the same dimension, a number of similar groups of people” collection, label value is “a set of similar groups of people” collection.
For example, if the user label is “Paid User”, there are three groups under the label with label values of “Large R”, “Medium R” and “Small R” respectively. There are three types of groups under the label with label values of “Large R”, “Medium R” and “Small R” respectively.
Users belonging to a tag have unique tag values, and if a tag has a historical version, the tag value of the user may be different for each historical version (each date) of the tag.
3.4.2 Creation of user tags
When you create a new one, you
can choose one of the three types of
tags: “Conditional tag”, “ID tag”, “SQL
tag”, and then enter the specific
creation configuration page.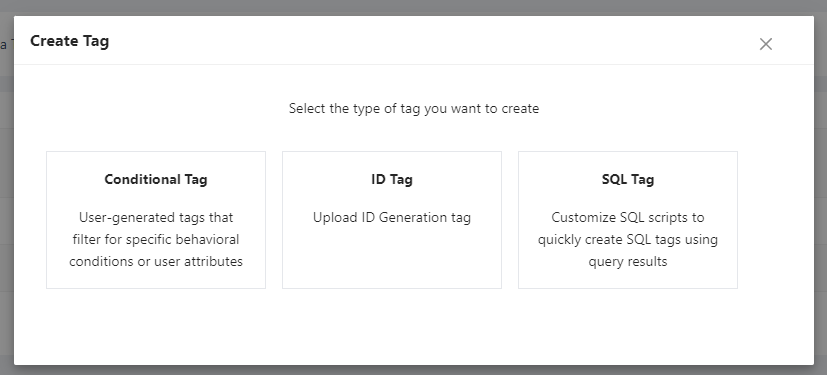
3.4.2.1 Tag Definition
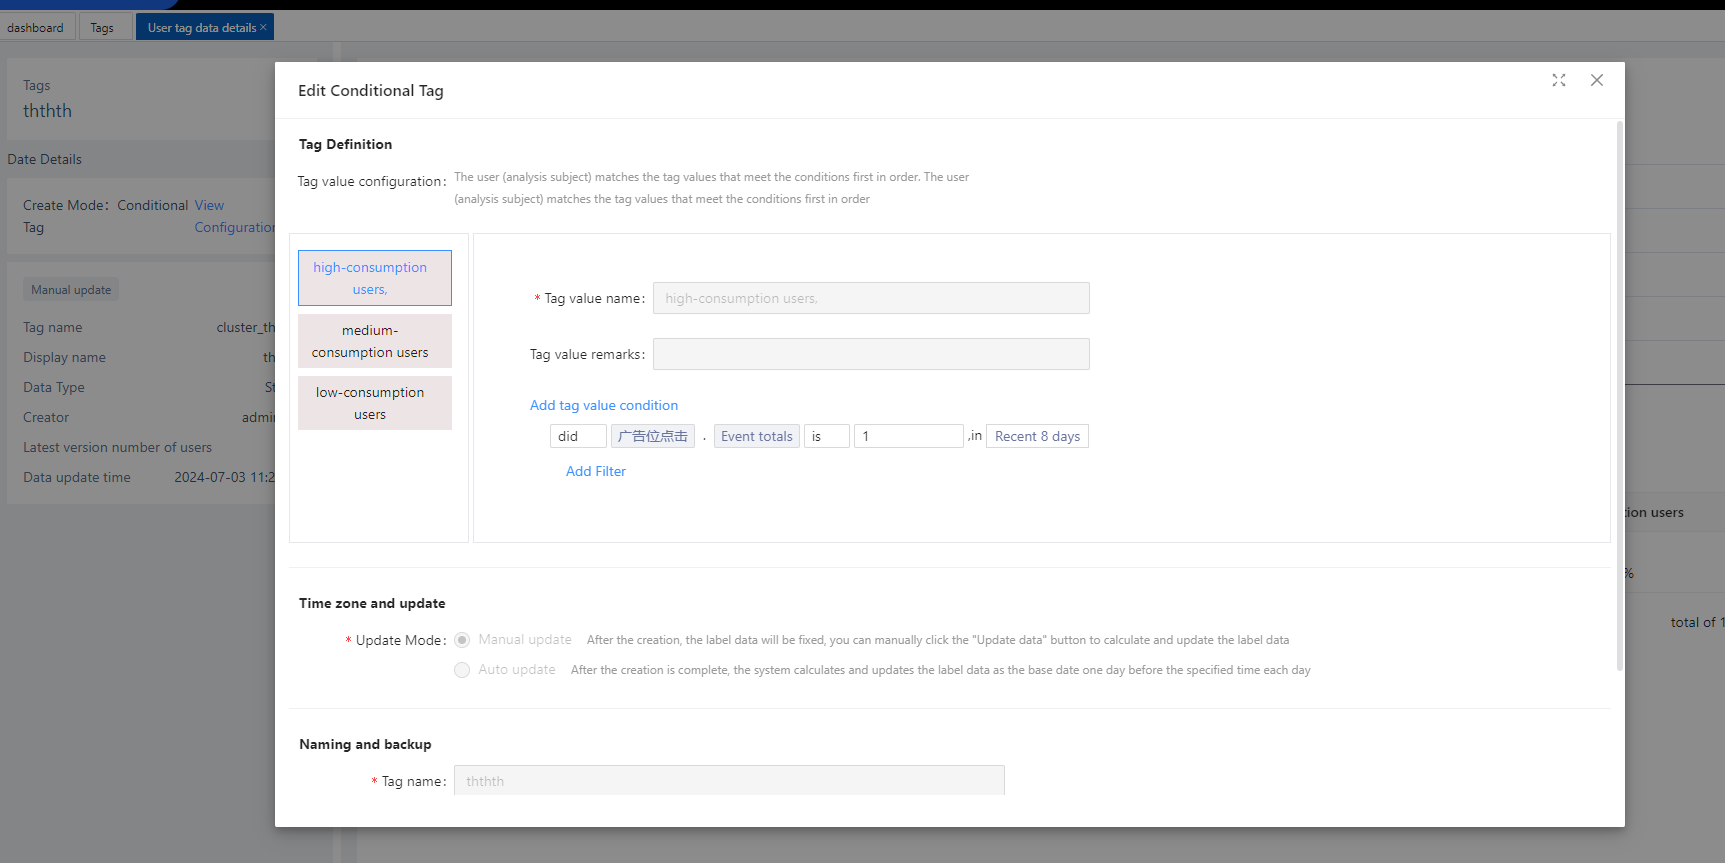
1、Conditional Tag
Filter users for specific behavioural conditions or user attributes and assign tag values.
For example, you can create a
“paid user tag” and then classify
users into high-consumption users,
medium-consumption users, and
low-consumption
users by customising the conditions. The
tag can then be used as a grouping item
to analyse all three types of users at
the same time.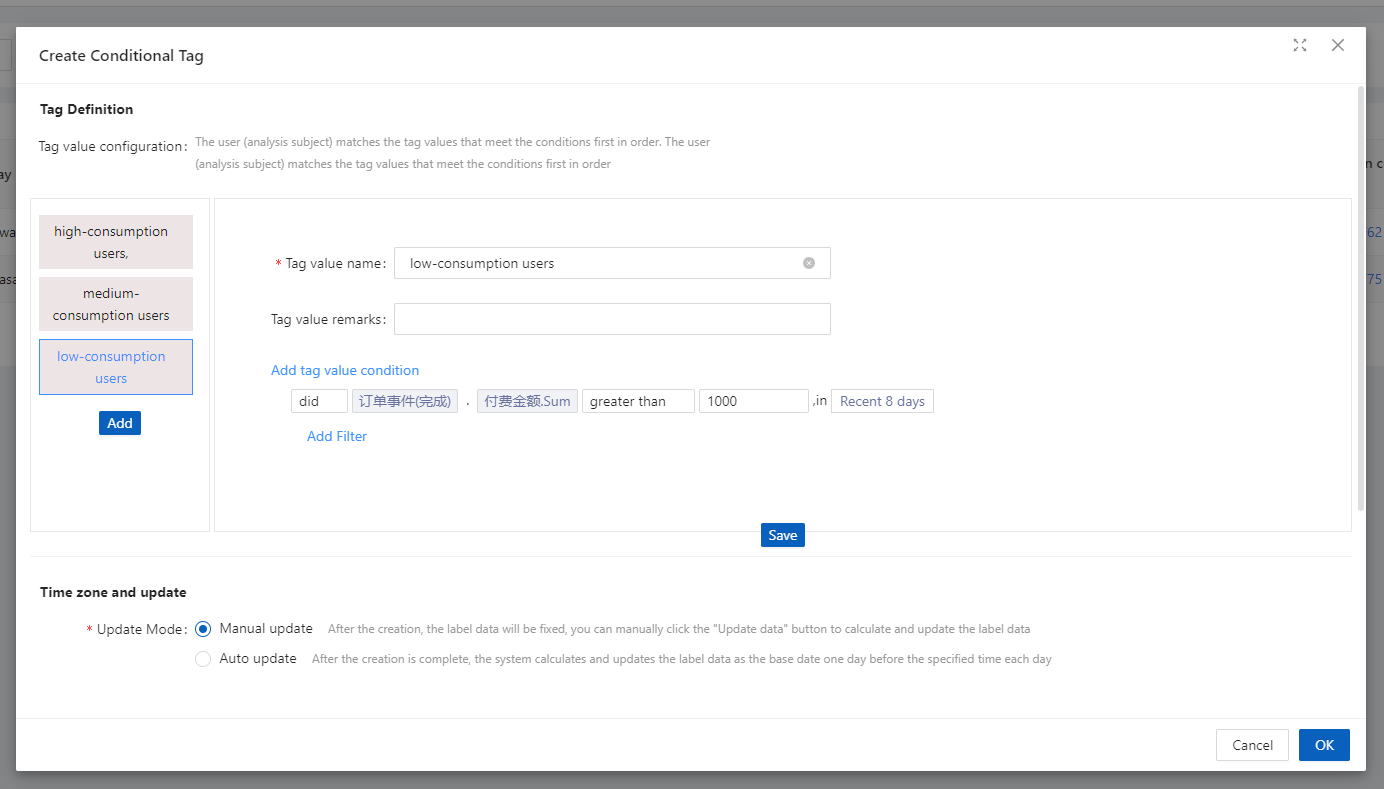
- The users in all tagged values together form the tagged user
- New tagged values are always added after the last tagged value.
2、ID Tag
Define the tagged user according
to the canonical upload ID required
by the template and assign the tagged
value at the same time, with the option
of
selecting a user attribute as the
associated field to judge the
user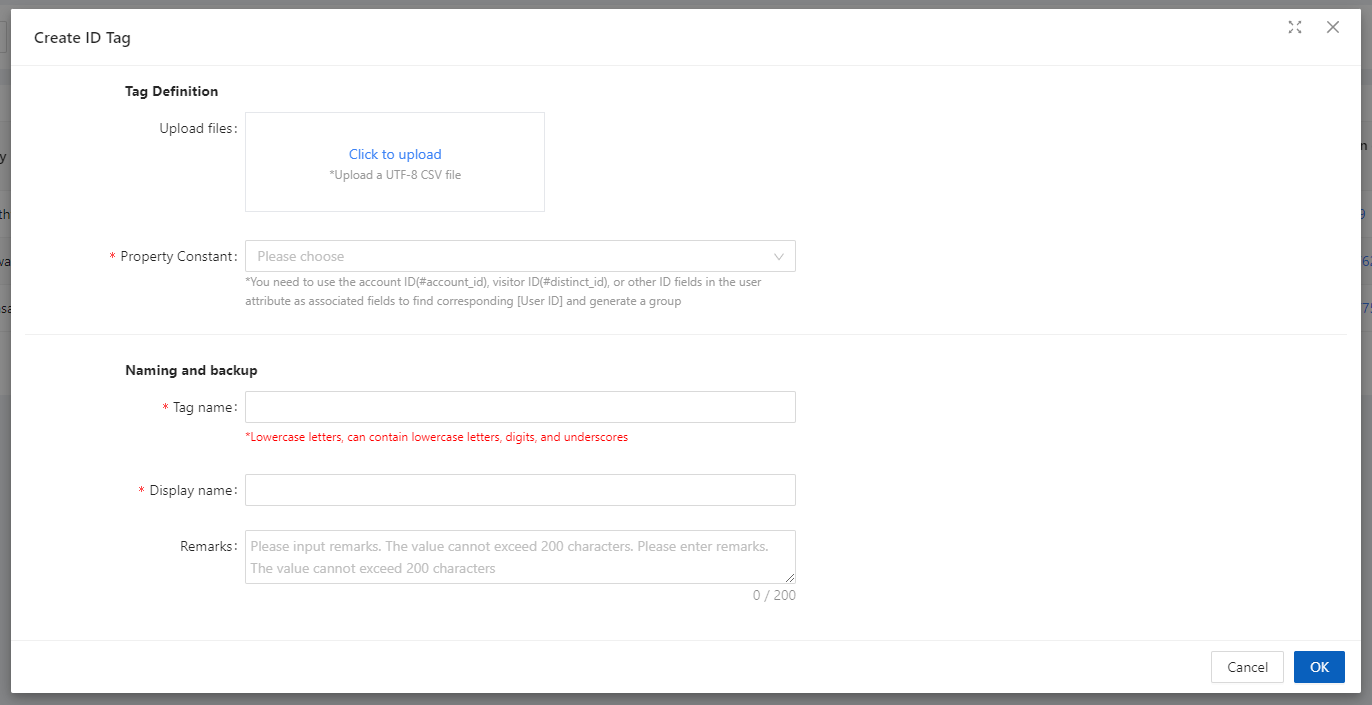
- Users with the same value in the second column will form the same tagged value
- If the user does not have a tagged value, then the row will be discarded and an alert will be given in the last step of the results display.
- ID Tag for upload type, cannot set “update method” and “backup method”.
You can select a user attribute as the associated field to judge the user, and any user ID that matches the value of the selected user attribute at the time of upload (the first column) will be assigned the corresponding tag value.
3、SQL Tag
Generating tagged values for analysis subjects based on SQL rules
(1) Tag condition settings at
creation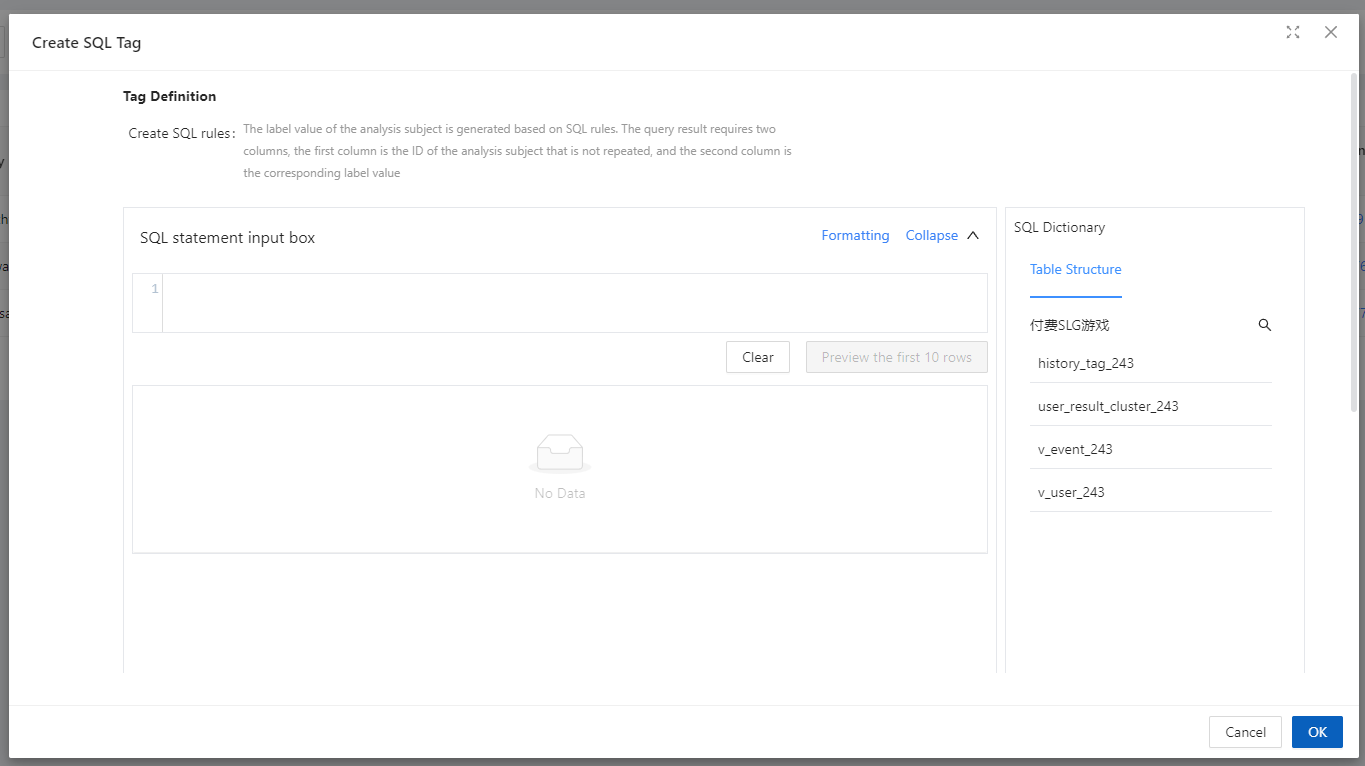
According to the required logic, write the corresponding statement in the SQL statement input box, the query result needs two columns, the first column is the non-repeated analysis subject ID and the second column is the tag value.
(2) SQL Dictionary
On the
right side of the creation interface, a
SQL dictionary is provided to facilitate
viewing the currently available table
structures, including event table, user
table, dimension table, temporary table,
etc., and copying the corresponding
field names or directly parsing the
3.4.2.2 Updates and Backups
Only when the tag type is not “ID Upload”, you can set the update method, the default option is “Manual Update”.
- Manual Update: After creation, the label data will be fixed, you can click “Update Data” button to calculate and update the label data manually.
- Automatic update: After creation, the system will calculate and update the tag data at the specified time of each day with the previous day as the base date.
3.4.3 User Tag List Page

- By clicking on the tag name, you can enter the user’s tag details page (data details).
- You can create a tag by clicking the “New Tag” button in the upper right corner.
- Click “Edit Tag” to enter the tag editing page.
- Clicking “Update Data” will recalculate the latest tag version using the current date as the base update date.
- Click “Download” to download user tag data directly.
- Click “Delete” to delete the tag.
3.4.4 User tag detail page
User tag detail page with tag
base information, data details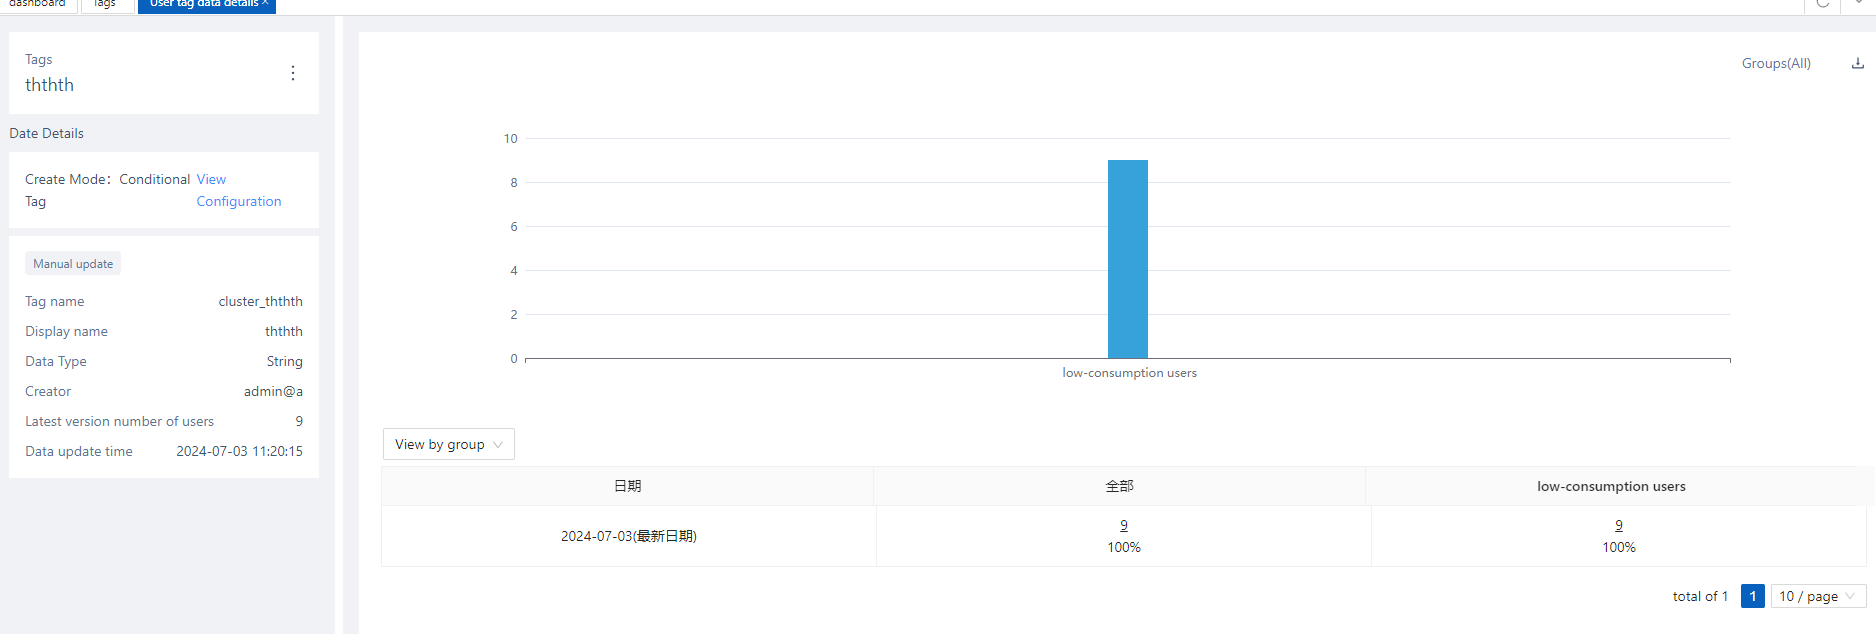
3.4.4.1 Tag base information
Display the basic information of tags, which is basically the same as the content displayed on the user tag list page.
- Click “View Configuration” to open the detail pop-up window, to see the specific conditions of creation
- Click the “More” button next to the tag name, you can operate, the same as the user tag list page.
4. User Search
4.1 The significance of user searches
User search is set in the navigation bar, so that users can search for matching users based on specified conditions on any page.
4.2 Location of user searches
It can be accessed from the search ICON in the navigation bar
4.3 Overview of pages searched by users
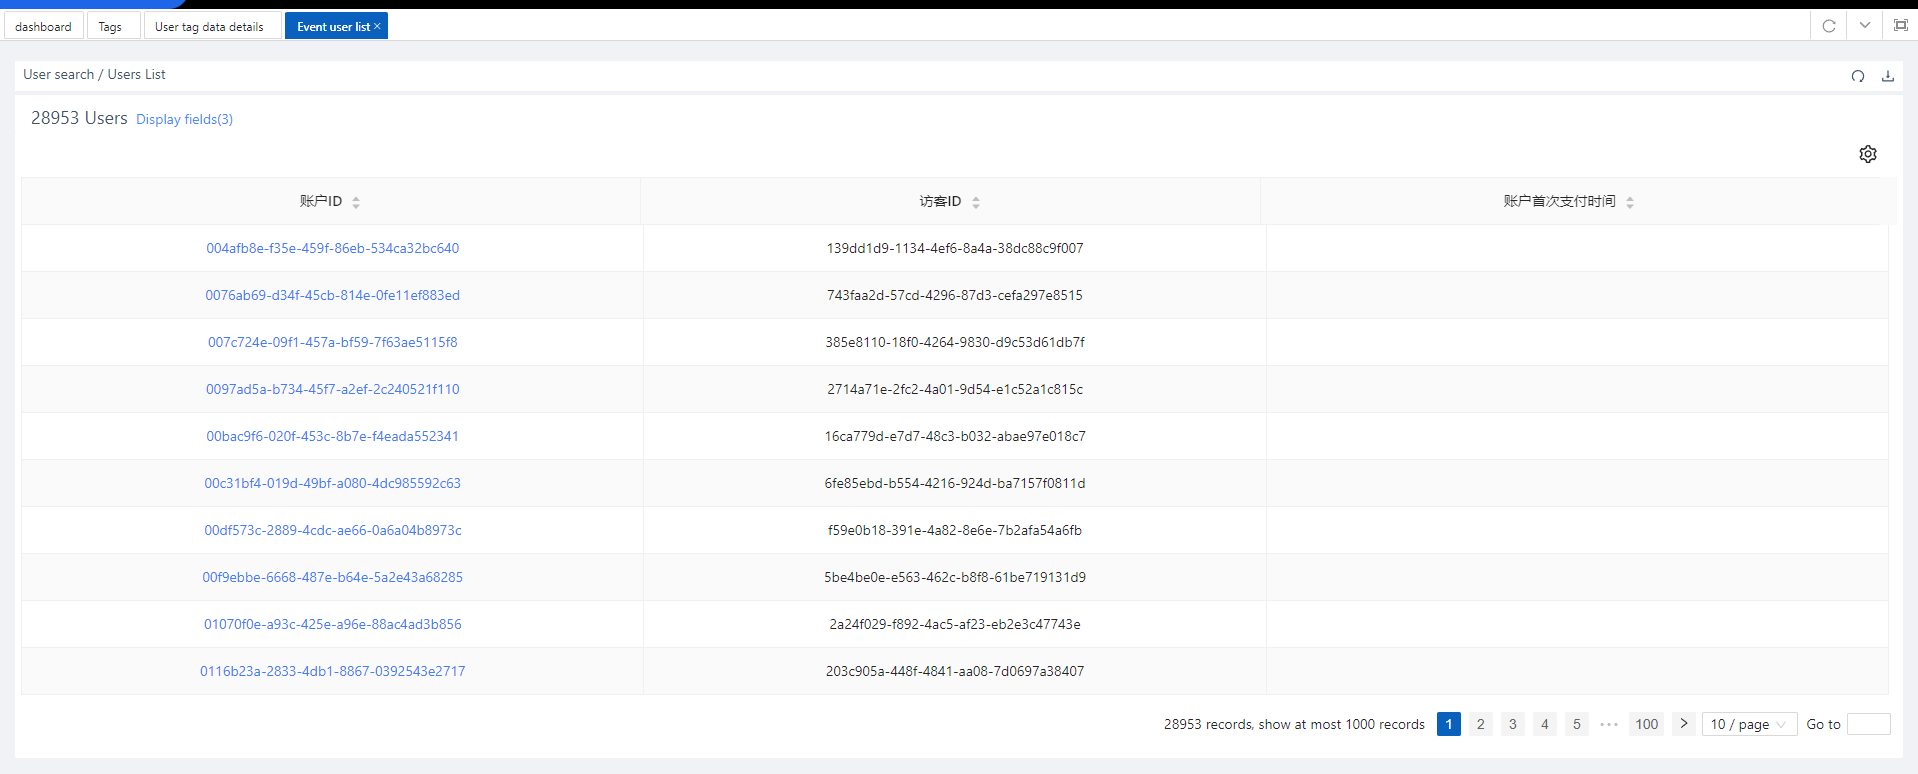
4.4 Usage scenarios for user search

4.4.1 Search scope and query matching method
- All “User Attributes” and “Account ID” sections can be searched.
- When filtering, only results that match exactly will be searched.
- You can enter the user behaviour sequence of the user by ID.
4.4.2 View a sequence of user behaviours for a single user
Clicking on a specific user takes you to that user’s specific behavioural sequence. This makes it easier to count user behaviour and track that user’s specific behavioural trajectory.
5. User Behaviour Sequence
5.1 The significance of user behaviour sequences
Allows microscopic observation of the specific behaviour of users who match certain characteristics. It is convenient to filter the attributes and do further analysis of the user’s specific behavioural distribution, behavioural paths, and behavioural characteristics preferences in a specific time zone. Thus achieving the purpose of improving efficiency and optimising decision-making.
5.2 Location of user behaviour sequences
To view the sequence of user
behaviours, you first need to click
into the list of users in the
calculation results of the model, and
then by
clicking on the underlined IDs in the
list of users, you can enter the
sequence
of user behaviours. The following are
the main entry points:
The “User
List”
page of the event analysis model where
the analysis dimension is “Number of
Triggered Users”.
The “User List”
page in the Retention Analytics model
for
“Number of Retainers, Number of
Churners”.
The “User List” page for
“Conversions, Churn” in the Funnel
Analytics model.
The “Users” page to
see
the number of people in each segment in
the distribution model.
The User
Details page to view node information in
the path analysis model.
5.3 Page overview of user behaviour sequences
5.4 Scenarios for the use of user behaviour sequences
5.4.1 Components of a user behaviour sequence page
5.4.1.1 Default Initial Page
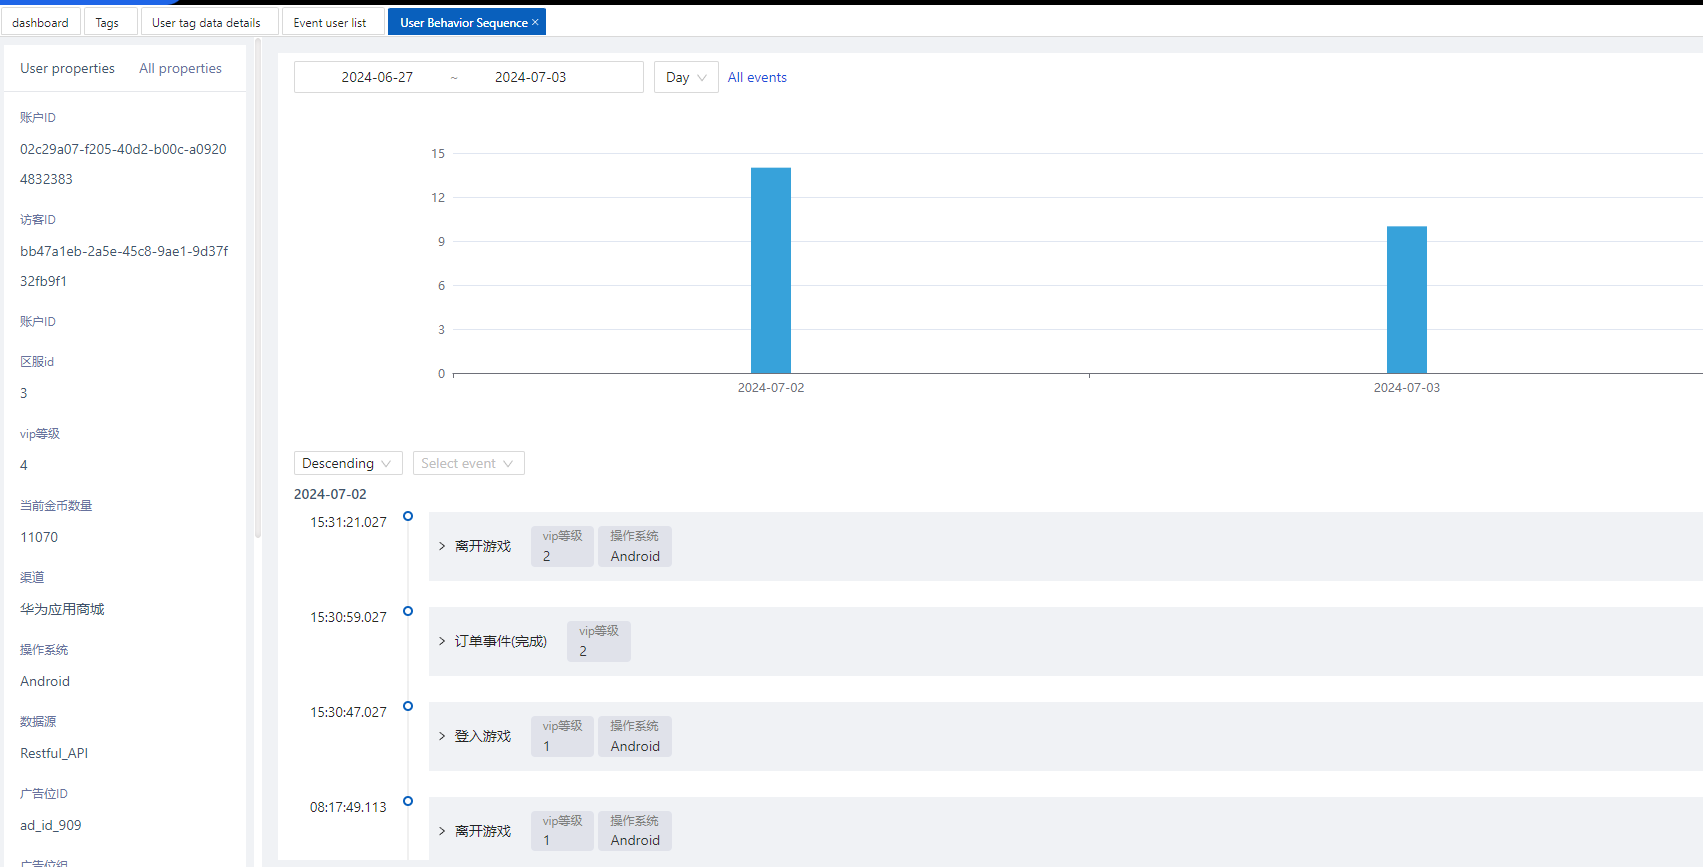
Includes user attributes area, behavioural statistics area, behavioural sequence details area
- User attribute area: view the user attributes of the current user.
- Behaviour statistics area: you can view the frequency of the current user’s behaviour according to the time granularity.
- Behavioural Sequence Details: view specific behavioural sequences and event attributes of the current user.
5.4.2 Contents and operations of the User Properties area
5.4.2.1 Filtering User Attributes
The first time you enter the
User Behaviour Sequence for an item,
all basic user attributes are selected
in full by default, including preset and
custom attributes.
The drop-down box
allows you to filter the user attributes
that need to be displayed, and after
filtering, the display will be changed.
5.4.3 Content and operation of the behavioural statistics area
5.4.3.1 Initial page (bar daily trend)
By default, you can view a trend graph of the number of daily behavioural events for the last 7 days.

5.4.3.2 Screening behavioural events
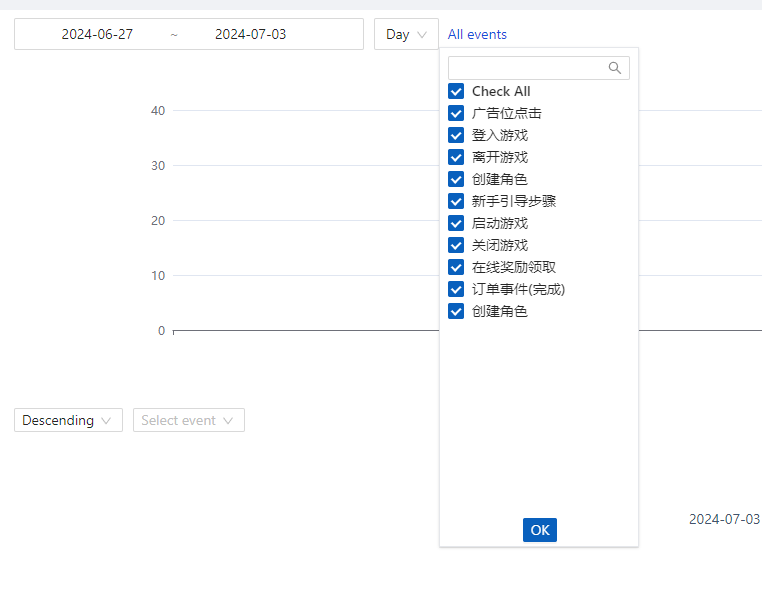
The first time you enter a user
behaviour sequence for a project,
all behavioural events are selected by
default.
The drop-down box allows you
to filter the behavioural events that
need to be analysed. After filtering,
the
display will change.
5.4.3.3 Settings and Effects of Time Selection
By default, the “Last 7 days”
time selection is selected and the
granularity of the timeline is “By day”.
This displays a graph of the trend of
the number of behaviours for the last 7
days.
You can click to select
different dates in the bar chart. In
this case, the dates under Behavioural
Sequence Details are anchored to the
corresponding days.
The granularity
of
the timeline is “By Day” and “By Hour”.
5.4.3.4 Calculated content of trend graphs
The charts will only count the filtered events and the trend charts will show the behavioural statistics at each time interval.
5.4.4 Content and operation of behavioural sequence details
5.4.4.1 Initial Page and Event Expansion Page
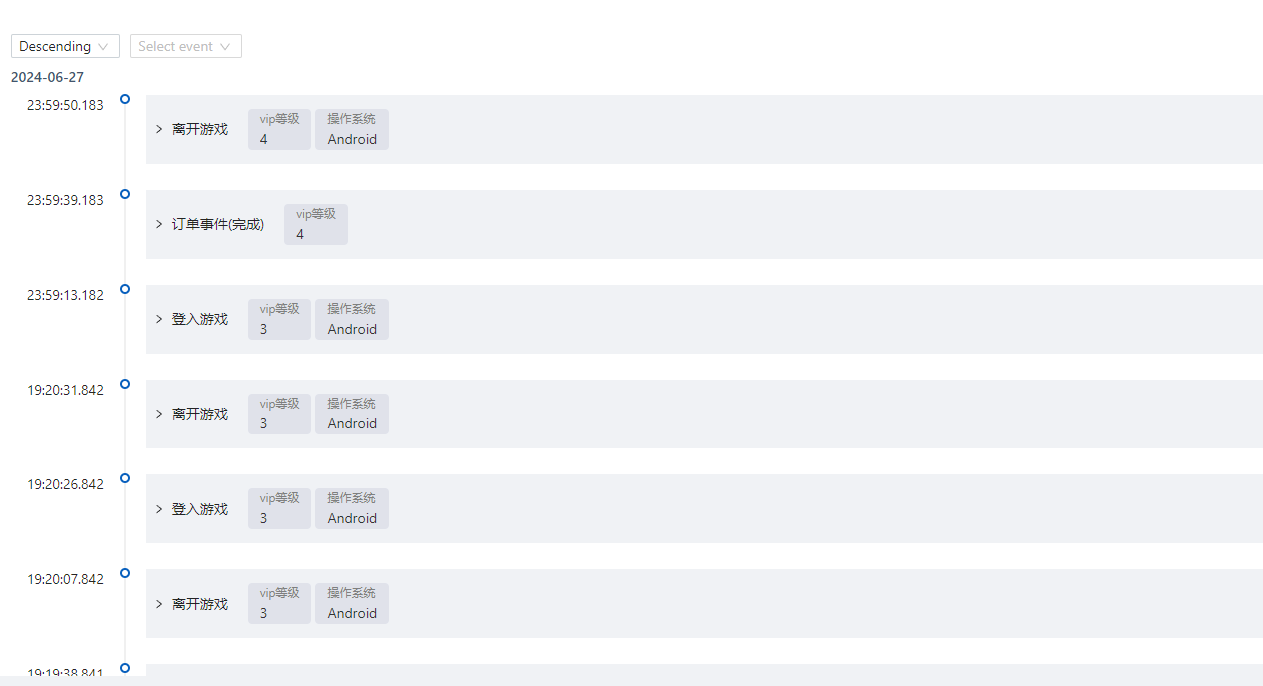
Initially “the last date for
which data are available in the Date
checkbox”, and is equivalent to
selecting this date.
If you select
“By day”
as the analysis interval, you can only
see the data under the selected
day.
If you select “Hourly” as the
analysis interval, you can only see the
data for each hour of the day under the
selected day.
5.4.4.2 Expand Event Details to see event properties
By clicking on an event, all
event properties under that event will
be expanded
五、Data
1. The significance of Data
Data management is mainly used to manage the presentation of all reported data, including modifying the display status of all events, event attributes and user attributes in the system; and adjusting the notes of events, event attributes and user attributes.
2. Location of Data
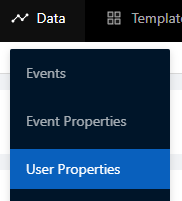
In the top navigation bar, “Events”, “Event Properties” and “User Properties” in “Data Management” are the categories of data management. “are the categories of Data.
3. Overview of the Data page
Data management is divided into
three parts: event management, event
attribute management, and user attribute
management.
Each part can be
searched individually, and after the
setup is complete, the events, event
attributes, and user attributes will be
displayed as new in each analysis model.
4. Data Usage Scenarios
4.1 Query Events
Events can be retrieved by filtering the specified conditions, all events are displayed by default, and the display status can be modified after clicking Display.

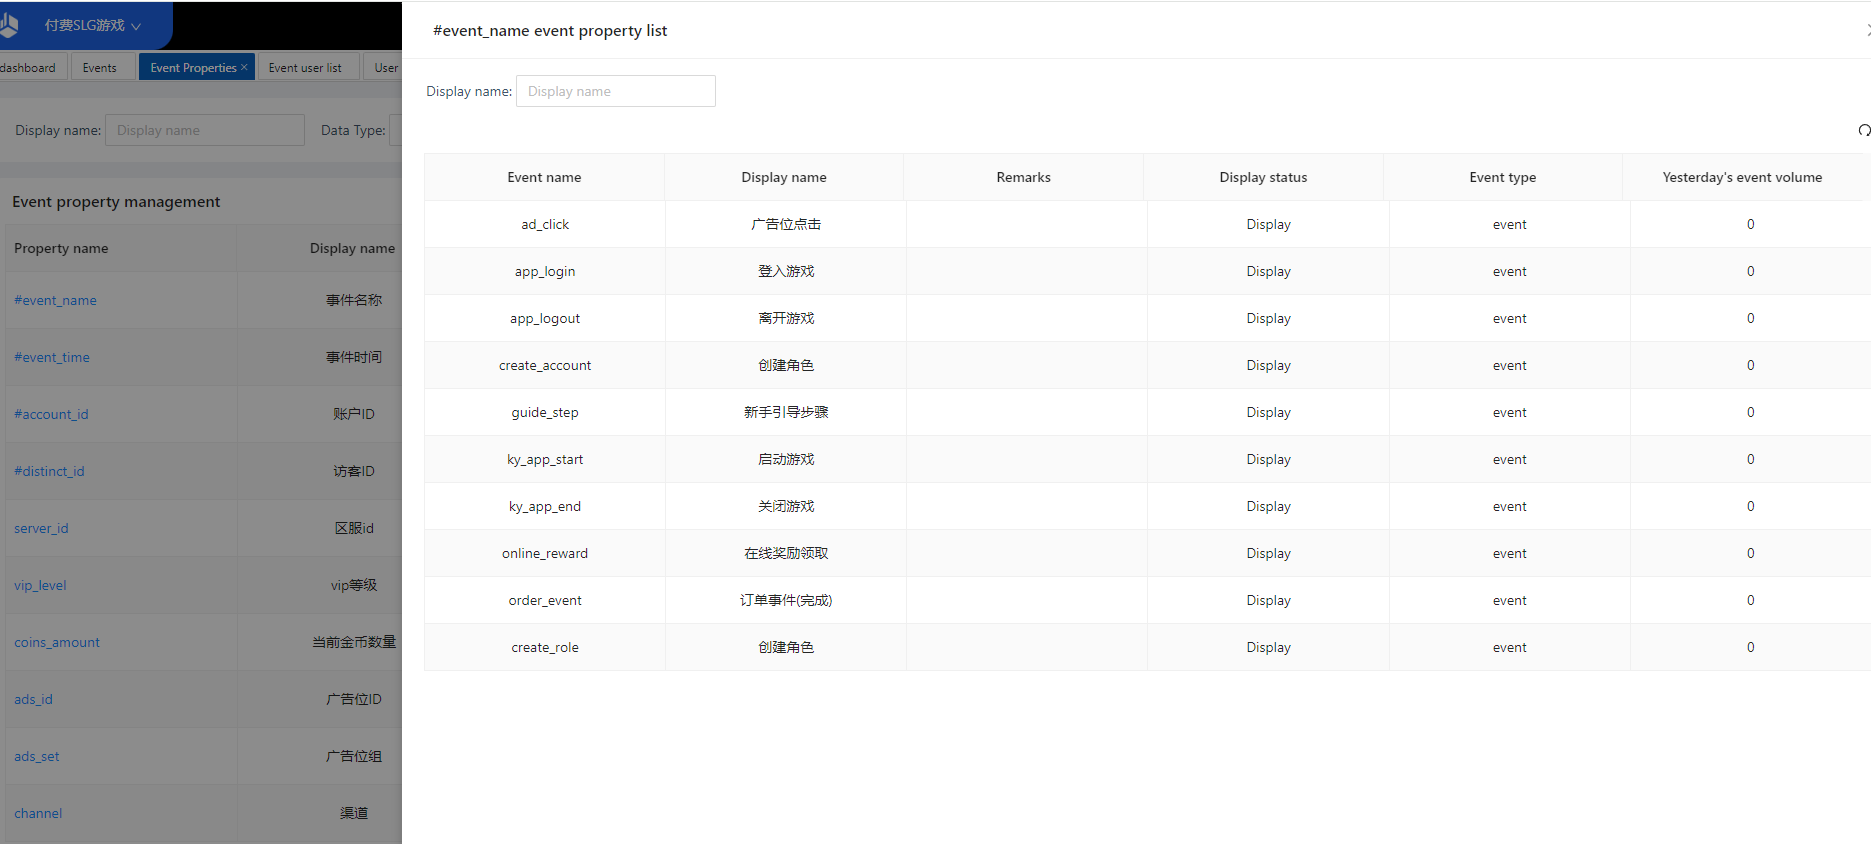
4.2 Query the event properties under a specific event
All event attributes under a specific event can be queried.
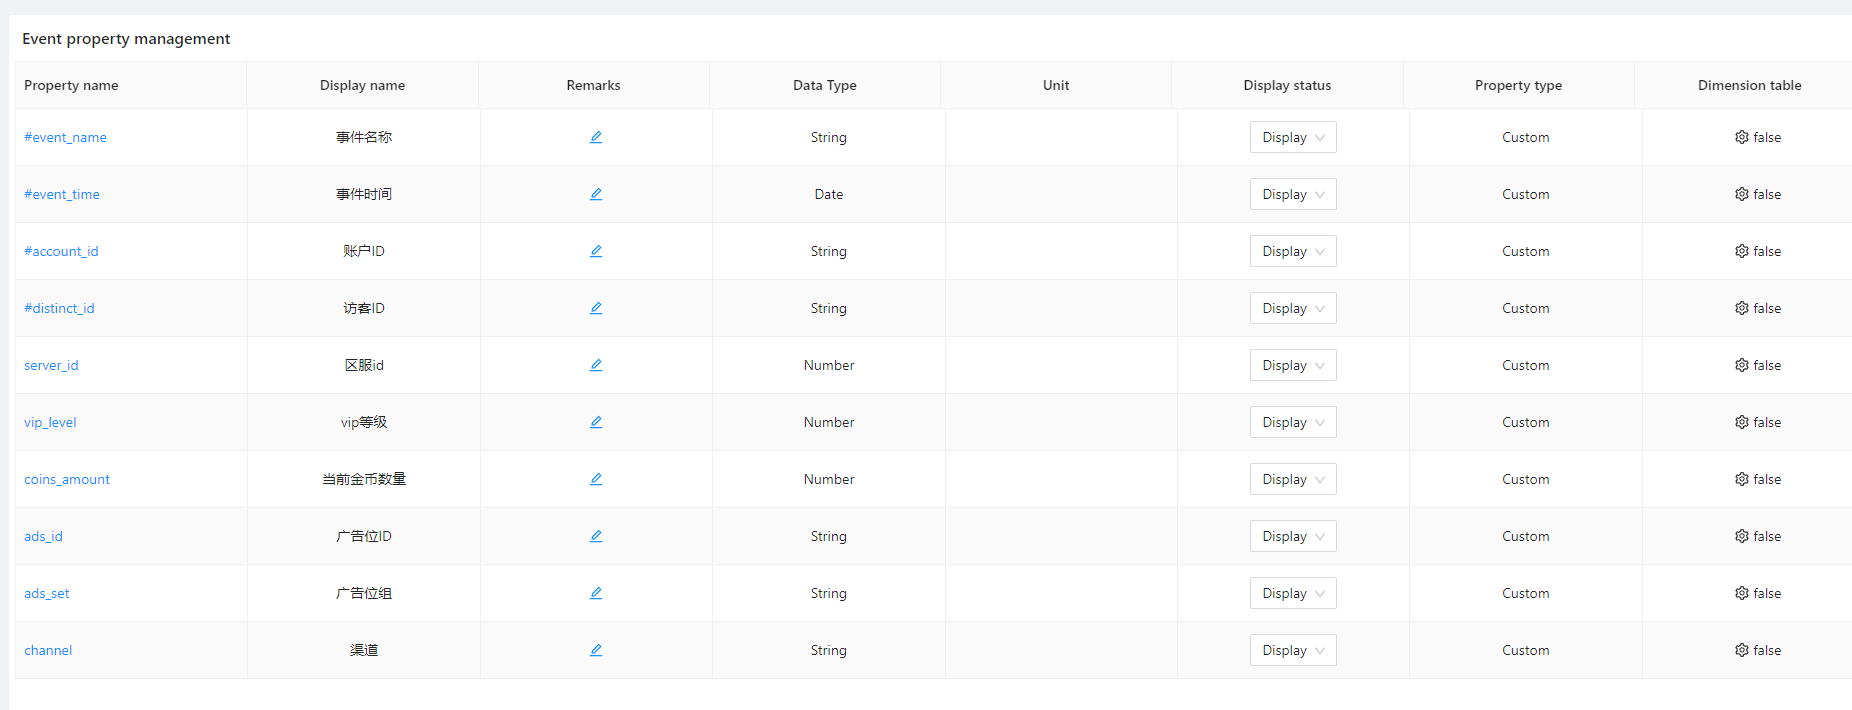
4.3 Querying and Editing Event Properties
Same as the query editing of event management, you can retrieve event attributes by filtering the specified conditions, and all event attributes are displayed by default.
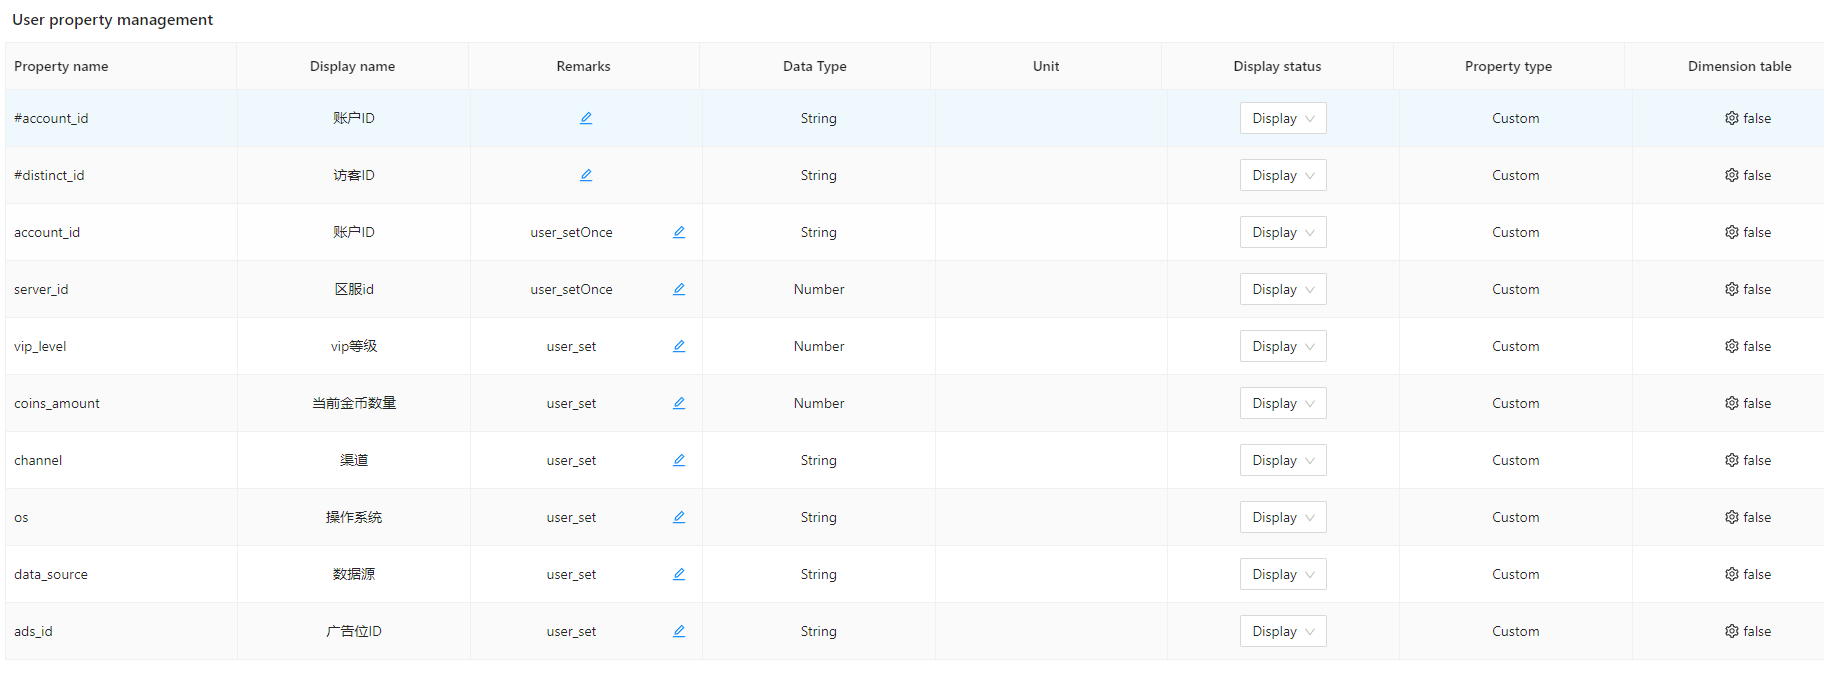
4.4 Querying and Editing User Attributes
Same as query editing in event management, user attributes can be retrieved by filtering the specified conditions, and all user attributes are displayed by default.
5. Dimension Table Properties
5.1 Meaning of Dimension Table Attributes
For event attributes and user attributes that have already been reported, the originally uploaded data can be mapped to another display or calculated value by uploading a dimension table, so that the attribute values at the time of the initial burial are not the same as the display values, and so that the data can be processed at a later stage to improve flexibility. Dimension table attributes can be used in filtering conditions and grouping items in the analytics model.
5.2 Scenarios for using dimension tables
Dimension Table Attribute: During data collection, channels may be recorded by channel number, for example, A01 for Xiaomi channel (Xiaomi App Store), A02 for Baidu channel (Baidu Mobile Assistant). If you want to use Chinese in the analysis, you can create a dimension table attribute for the “Channel” attribute and set the Chinese name corresponding to the channel number in the dimension table. In the dimension table, you can use the dimension table attribute “Channel Name” with the corresponding Chinese name in the calculation.
5.3 Concept of Dimension Table Attributes
5.3.1 Basic Overview of Attribute Types
- Custom Attributes: Attributes that are customised to be uploaded based on business requirements, such as paid amount, etc.
- Dimension table attributes: newly
generated attributes by
uploading
dimension tables based on
existing attributes, which may
disappear due to
overwriting
Note: There are five data types: text, numeric, time, boolean, and array.
5.3.2 Creating Dimension Table Properties
5.3.2.1 Create an Entrance
You can create dimension table
attributes in Event Attribute
Management and User Attribute Management
in Data Management.
5.3.2.2 Upload dimension table
1、Please select “Upload”
dimension table attribute on the
original
attribute field where you need to add
dimension table.
2、The specific rules
of dimension table file
- The first line of content will be the field name of the dimension table attribute, which should start with English, and be composed of English, numbers or “_”.
- The content of the first column will
be associated with the original
attribute, and the values taken
need to correspond to the
original attribute
values and ensure that the
values are unique. If duplicates
are encountered,
the first one will prevail and
subsequent duplicates will be
discarded.
3、Save the csv file in UTF-8 encoding format.
4、Add the dimension table file to the upload location.
5、Fill in the display name and field type.
6、System parsing situation prompts
7、After finishing, you can find the newly added dimension table attributes in the list.
8、You can use the dimension table attributes in the model for analysis.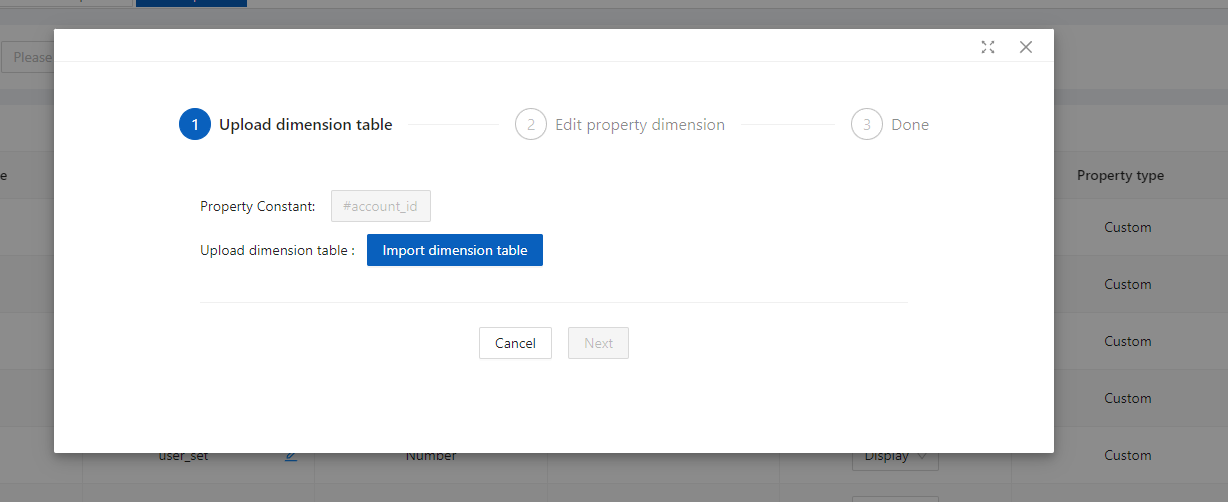
5.3.3 Use of Dimension Table Attributes
5.3.3.1 Managing Dimension Table Properties
Dimension table attributes can be managed on the Event Attribute Management or User Attribute Management page.
5.3.3.2 Download & Delete
Dimension table properties can be deleted by selecting the “Delete” option from the popup that appears when you click on the button.
